Skip to content
- Make the most of available battery capacity
- Traditional pack side fuel gauge
- System side impedance tracking fuel gauge
- What are the functions of the fuel gauge
- How to implement a fuel gauge
- Voltage based fuel gauge
- Battery resistance
- Impedance is related to temperature and DOD
- Impedance difference of new batteries
- Transient response
- Voltage relaxation and state-of-charge errors
- SOC error of electricity monitoring
Make the most of available battery capacity
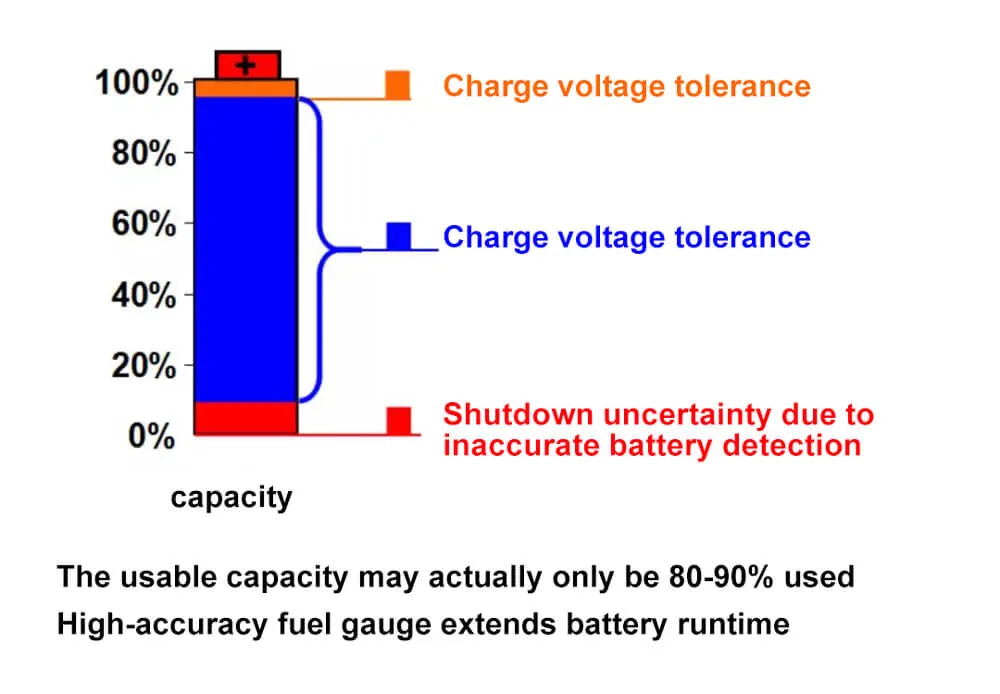
The main purpose of battery power monitoring is to maximize the use of the capacity in the battery. Generally speaking, it is difficult for us to use 100% of the capacity in the battery. Why?
There are two factors here. First, when charging, it is difficult for the charging voltage to be exactly the full charging voltage of the battery. Usually, in order to prevent the battery from overshooting, the charging voltage error is biased downward. That is to say, the charging voltage of the battery may be or, so that if it is charged at this low charging voltage, the charged capacity may become smaller.
In addition, due to the inaccuracy of battery power monitoring, users may estimate the power conservatively for safety and to prevent data loss due to sudden critical issues, that is to say, when the real power of the battery has not reached 0%, he will report it to 0% in advance, let the system shut down in advance, so as to avoid user data loss. Of course, the user experience feels that the battery capacity has become smaller, which is a disadvantage.
The consequence of this is also that the capacity of the battery cannot be fully utilized. The battery power monitoring technology is to maximize the monitoring of the battery power, so that the user can use the current capacity of the battery to the greatest extent, this blue section actually refers to the effective capacity of the battery. Our technology is to expand the actual effective capacity up or down as much as possible.
Traditional pack side fuel gauge
This is a block diagram of a traditional battery pack for single-cell portable applications. The fuel gauge is located on the side of the battery pack to continuously monitor battery operation and provide remaining capacity or runtime information to the host via I2C or single-wire protocol.
However, when the battery cycle life came to an end, we had to throw away the battery pack even though the fuel gauge was still in good condition. We were forced to buy another battery pack with a fuel gauge, increasing the cost to the end user. Can we put fuel gauges on the host side to minimize costs?
The traditional battery pack power monitoring technology has such a frame structure, and the power monitoring chip is generally placed in the battery pack. There is also a protector that controls the MOS tube. This protector switches the MOS to protect the battery cell when the battery is overcharged or overdischarged.
Generally, a thermistor is placed in the battery pack to monitor the battery pack. Temperature, except that the left side refers to the system board of the mobile phone or tablet, the power management chip and the host’s processor are mainly related to the fuel gauge on this system board. The host’s processor is usually through I2C or single-wire. HDQ bus to read the power information in the fuel gauge.
In the case of knowing this power information, it is decided how much time is left until the battery is completely discharged. Some users can prompt the user whether the current power is sufficient when they want to do certain things, this is a traditional solution, that is, a solution that puts the fuel gauge in the battery pack. TI’s main devices in this regard are the two main chips BQ27541 and BQ27545.
BQ27441, this is a relatively low-cost solution; we also have BQ27741, which is a solution that combines a fuel gauge and a protector; BQ28z560, which is also a solution that includes a fuel gauge and a protector.

System side impedance tracking fuel gauge
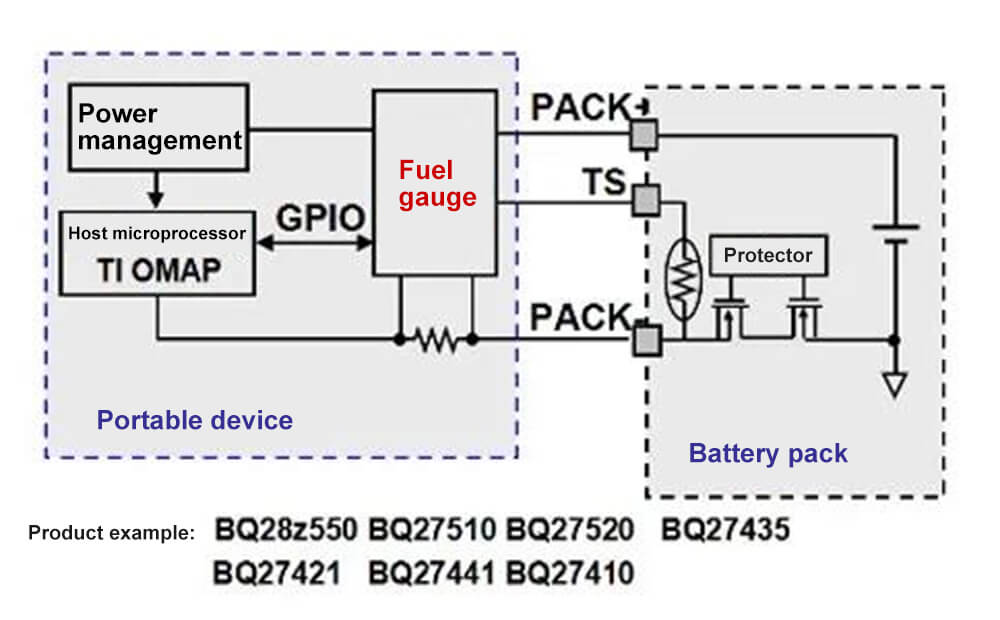
In this schematic, the fuel gauge is on the host side to minimize battery pack cost. This way, we don’t have to buy another set of electronic components in the battery pack when the battery pack’s useful life is over.
With the advancement of technology, or the introduction of TI’s impedance tracking technology, there is now such an application, where the fuel gauge is placed on the main board side of the device, and there is only a protector and MOS tube on the battery side. There is a thermistor, and of course there is a battery in it, what’s the benefit of this?
The cost of the battery pack is greatly reduced, and the supplier of the battery pack is easier to find, because he moved the fuel gauge from the battery pack to the host side, so such a solution is now feasible. TI also provides support for this 2 programs are supported.
There is also the BQ28z550. This solution is to put the fuel gauge on the system board of the portable device, so that the battery pack does not need a discharge gauge, which can reduce the cost of the battery pack and make it easier to find suppliers. This TI The main fuel gauges are BQ27510, BQ27520, BQ27441 can also be used in this occasion, as well as BQ27425, BQ27421… and so on.
What are the functions of the fuel gauge
Communication between battery and user
• Measurement:
–Battery voltage
– Charge or discharge current
– Temperature
• Provide:
– Battery runtime and remaining capacity
– Battery health information
– Overall battery power management (working mode)
What are the main functions of the electricity meter? The fuel gauge must first complete the communication between the system and the battery. The system needs to know how much power the battery has, and needs to communicate with the fuel gauge via bus. I just mentioned that I2C and single-wire HDQ bus communication are obtained. During the communication process , What information can the system obtain?
The first is the measured analog information, such as battery voltage, battery charge level and discharge current, and battery temperature. These basic analog information is used as a fuel gauge, it is more important to provide battery capacity information,
That is to say, the remaining capacity of the battery, the operating time of the battery, and the information about the health status of the battery, and the other is that the chip itself must be able to complete the transition of the working status, that is to say, it must change from the normal working mode, go to low power consumption mode, realize this kind of change, achieve what purpose? achieve the purpose of saving power.
How to implement a fuel gauge
How to realize power monitoring?
The first method is voltage-based power monitoring. The percentage of power or capacity is regarded as a function of battery voltage. This is a formula obtained from experience. Of course, the expression of this function itself does not have to be To get it, it only needs to get a table corresponding to the open circuit voltage and the capacity percentage, and the data between each point in this table can be obtained by the method of difference compensation.
Another method is coulomb counting, which is an energy obtained by integrating the current charged into the battery or discharged from the battery. We can think of the battery as the fuel tank of our car. How much oil is filled in this fuel tank and how much oil is released can calculate how much fuel is left in it. This is also a relatively intuitive algorithm based on life experience.
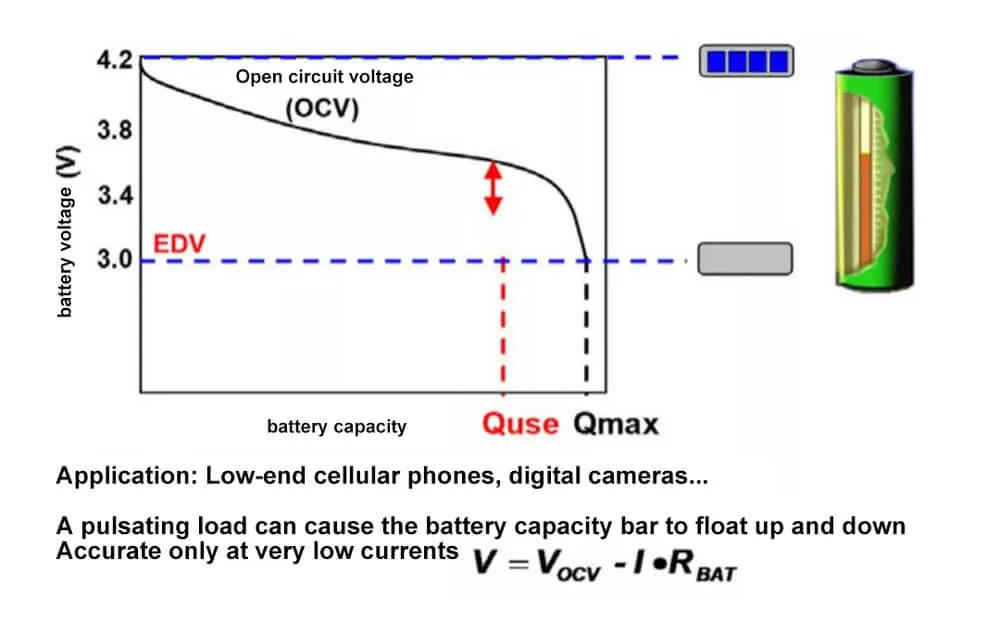
Now the latest algorithm is the impedance tracking algorithm. In fact, this algorithm is based on the real-time internal resistance measurement of the battery to obtain the battery capacity. Its formula is the formula in the figure, which has been listed just now, that is, the terminal voltage V It is equal to the open circuit voltage of the battery minus the current multiplied by the internal resistance of the battery. This current refers to a total current flowing into or out of the battery.
Voltage based fuel gauge
Let’s first introduce the voltage-based fuel gauge. This picture is the open-circuit voltage curve of a battery. The basic idea of this method is to use different grid numbers to represent the capacity of the battery for different voltages. For example, use 4 when Grid to indicate that this is a full battery. When I may use 3 grids to indicate battery capacity, use 2 grids.
It may be possible to use 1 grid to represent the capacity of the battery, that is to say, use different grid numbers to correspond to different battery voltages to represent the capacity of the battery. This method is relatively inaccurate, and is usually used in the earliest low-end cells. Phones, or digital cameras in the early days. What’s the problem with this approach?
That is to say, when the current fluctuates, it will jump up and down. For example, if I have a discharge current, or if the current is relatively large, you can see the red arrow during the discharge process. If the current At this point it suddenly decreases, or I suddenly become 0,
This voltage will obviously go up. If the voltage is generally raised to this point, its grid number will become 2 grids. When it goes down, the change will be more obvious. When it goes down, the number of battery grids may be Close to 0 grids or use red color to indicate the number of grids of the battery, the jump at this time will change from red color to 2 grids, and it will jump back and forth at this time. If the current changes,
For example, he just called and stopped here, and the battery has 2 cells left. He thought there was still electricity, and then he suddenly made another call, and it became 0 at once, so the error of this representation will be relatively large, because You can see that the battery capacity is actually represented by 4 grids.
Because 1 grid corresponds to 25% of the capacity, there is a 25% capacity difference for jumping one grid, and a 50% capacity difference when jumping 2 grids, so the error of this method is relatively large. The reason for the relatively large error is because the battery has internal resistance, and in the case of relatively large current, its grid number jumps more.
Battery resistance
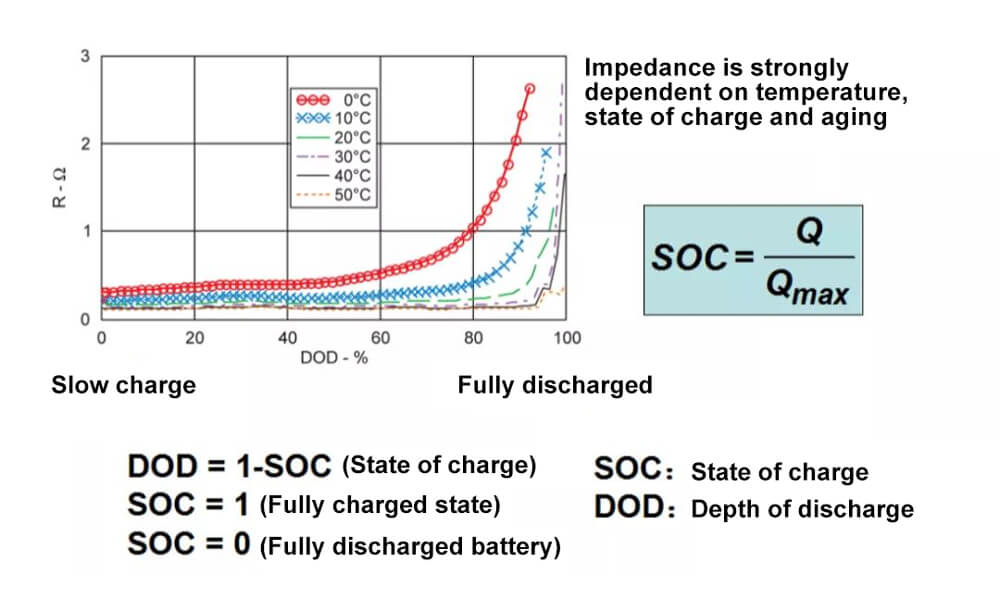
This is a formula for the open circuit voltage and terminal voltage of the battery. It has just been said that the internal resistance of the battery is a function of temperature, state of charge level and battery aging.
The internal resistance of the battery will double after 100 charges and discharges; the impedance deviation of the same batch of batteries may be 10~15%; the internal resistance deviation of different battery manufacturers or manufacturers with poor quality will be larger.
Impedance is related to temperature and DOD
One of the information that has the greatest influence on the capacity calculation or is the most difficult to obtain is I*Rbat. Of course, I is relatively easy to obtain, as long as the current flowing in and out can be measured. With the current technology, the accuracy of ±1mA can be measured. . Then this Rbat is relatively difficult to measure, because it is calculated based on two quantities.
The above figure is mainly the relationship between impedance and temperature and capacity percentage. This relationship has been mentioned just now. Basically, impedance increases with the decrease of temperature, and increases with the decrease of capacity percentage. It is such a concept.
Impedance difference of new batteries
This is the deviation of impedance. What kind of concept is this? That is to say, in general, the impedance used has a greater impact on the electricity metering, which refers to the impedance in the low frequency state, which is the impedance at 1mHZ,
In fact, it is the DC impedance, not the impedance that we usually measure with the internal resistance tester we see in the market. That impedance is the internal resistance of the battery measured at 1KHZ, and the internal resistance usually looks relatively small.
The above are the three factors that have an impact on the accuracy of the capacity calculation, which are temperature, capacity percentage and aging degree. These factors will affect the capacity calculation. This effect refers to the method of monitoring the power with voltage.
In addition to the influence of these factors, if the voltage monitoring method is used, there is another influence that cannot be ignored, and this influence is also difficult to handle. This is a headache for many power management engineers. The problem of dynamic response.
Transient response
You can see from these two pictures that the battery is discharged when it is relatively fully charged. The previous curve represents a discharge process. At this time, the voltage is relatively low, and then the load is removed. At this time, the voltage of the battery is It does not immediately return to the time when the current is 0, because everyone thinks that the current becomes 0 when the load is removed. Does the voltage at this time return to the voltage where the current is 0?
no. It went back up slowly, it took a long time to go back up, and you can see this curve. Everyone’s usual experience can also prove this point, that is to say, after a battery is discharged, and then you remove the load, its voltage is constantly changing, so how long does it take for this voltage to change and stabilize? It takes about 1600 seconds to get to this point. Basically, it takes about 3500 seconds to stabilize. It takes about 2000 seconds to stabilize. This is the discharge when the voltage is about to reach, which means that the battery is not full at this time. .
According to what I just introduced, when the battery is relatively full, that is, when the battery capacity percentage is relatively large, the internal resistance of the battery is relatively small at this time, and when the internal resistance of the battery is relatively small, it recovers fairly quickly.
In the picture below, you can see that the voltage on this side is relatively low. It starts to discharge from the left and right. After a period of time, this time is also very short. Because the lithium battery voltage is relatively low, discharge it for a while. It is close to the lowest voltage that the system can accept. If the discharge is stopped at this time, how long does it take for the voltage to return to it? Basically, it will take a longer time.
For example, it takes more than 3000 seconds to stabilize the voltage, so during this time, its voltage is not stable enough, but there is no load, the current is always 0, at this time you read the voltage, the voltage is always changing Yes, what is the corresponding capacity percentage? Errors will occur at this time.
Voltage relaxation and state-of-charge errors
You can see that the voltage difference between 20 and 3000 seconds can exceed 20mV, then the voltage value of 20mV can cause a large capacity deviation when calculating the capacity, especially in the flat region of the voltage discharge. It can cause a large capacity deviation, so the transient response of the battery will cause a relatively large error in the measurement method that uses voltage to monitor.
In this curve, this curve reverses the discharge curve of the battery. The ordinate becomes the capacity percentage, and the abscissa is the voltage of the battery. What does this picture mean? That is to say, at this stage, the battery is actually in the middle stage. If you stretch the platform a little, you can see that the voltage change is relatively slow during this period, and the capacity change is relatively large. The voltage is used to monitor the capacity, so a little error in this voltage will cause a large error in the capacity.
The picture on the right refers to the error of the corresponding capacity under different voltages. You can see that at the middle point of the voltage, that is, the voltage of the discharge curve is flat, that is, to the left and right, the corresponding error during this period is the largest. , the error corresponding to this time can reach 15%, which is the error caused by the voltage method to calculate the capacity.
Therefore, the errors based on voltage monitoring and measurement are mainly caused by these aspects. One is the relaxation error, which is the recovery time of the voltage of the battery after the load is removed. A typical value here is the relaxation measurement of 20mV. Error, the actual error will be much larger than this relaxation error. You can take a look after the battery is vented. When the voltage is stabilized just after the venting, their voltage error is actually very large.
There is also a 15% resistance error between batteries. As I said just now, if the process of the same batch of batteries produced by the same supplier is well controlled, the internal resistance deviation of these batteries may be 15%. This is still a good situation, but if different suppliers or suppliers have poor process control, the resistance error between the cells will be larger.
In the picture on the left, we can see that the red refers to the relaxation error caused by the transient effect of the battery. The light blue curve above is the error caused by the deviation between the individual impedances of the battery. These 2 The total deviation can be about 15%. This is 15% of the new battery, or a test result obtained when the current is well controlled.
SOC error of electricity monitoring
The factors that cause the voltage compensation error are as follows:
– Transient error
–15% inter-cell impedance deviation
-Measurement error
The overall error is within an acceptable range for a new soc battery, but will soon exceed it with age (image on the right)
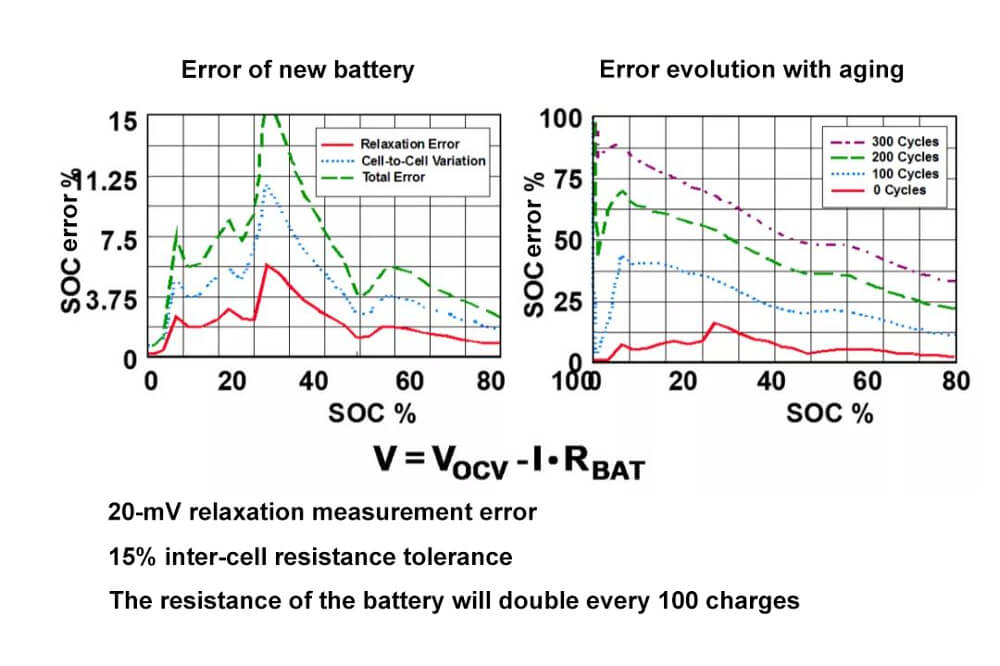
As we all know, there is a relatively large factor affecting the capacity calculation of the soc battery, which is the service life of the soc battery. In this picture, the errors measured under different service years, the red indicates the 1st or 0th time obtained. The error curve obtained by the cycle of , this curve is about 15% of our icon, and the last marked here is 15%,
Then after 100 cycles, we know that the impedance has actually doubled. You can also see in the picture just now that the internal resistance of the soc battery has doubled after 100 cycles. If you continue to go up according to this rule, the error will become larger and larger, and the impedance will increase. The error caused by the error of the capacity is correspondingly larger and larger,
So basically after 300 cycles, the error caused by the relatively low capacity will be very large, 75% or more, so the power calculation technology based on voltage measurement can only be used in those occasions with low requirements,
Its error is relatively large. Usually, the soc battery in the early diqital camera uses this method to calculate its capacity. Then the internal resistance of the battery has the greatest impact on this capacity calculation, resulting in a relatively large change in the internal resistance of the battery. The reason is that the manufacturing process of the battery causes the deviation of the internal resistance of the battery.
The other is that the internal resistance of the soc battery will also change greatly due to the delay of the battery usage time. It is difficult for engineers to know an accurate model for these changes. They can only estimate based on experience, so that the estimated results and the actual results are different There will be large deviations.