- Carbon pricing concept
- Carbon tax and carbon emissions trading system
- Carbon credit market and mechanism
- Voluntary market activity brings rapid growth of carbon credit market
- Voluntary commitments by businesses are key drivers of market growth
- Differences in buyer preferences lead to uneven development of the carbon credit market
- New financial services and technologies are entering the carbon credit market
Carbon pricing concept
Carbon pricing is the main tool that governments use to implement climate strategies. Governments can use a range of policy tools to set carbon pricing. The impact of carbon pricing on the climate is related to the acceptability of the carbon pricing in the country, the price level and the opportunity to reduce carbon emission. In the long run, creating a credible and more predictable price signal will support long-term investment and encourage low-carbon development.
Carbon pricing is divided into direct carbon pricing and indirect carbon pricing
Direct carbon pricing uses a price proportional to the amount of greenhouse gas emissions produced by a given product or activity to incentivize carbon emission reductions, mainly through carbon taxes or carbon emissions trading.
Carbon credits are another form of carbon pricing, but there is a difference between carbon emissions trading and carbon taxes. The carbon credit mechanism is consistent with the emission reduction plan advocated internationally.
Indirect carbon pricing refers to tools that change the price of products related to carbon emissions in a way that is not proportional to carbon emissions. These tools provide carbon pricing signals, although they are often used for other socioeconomic goals, such as increasing incomes or tackling air pollution. Indirect carbon pricing includes: fuel tax and commodity tax, fuel subsidies related to energy consumption, etc.
Direct carbon pricing and indirect carbon pricing can interact, for example, if the price signal provided by direct carbon pricing due to the introduction of subsidies that lower fuel prices is offset by the price reduction factor of indirect carbon pricing, the effect of direct carbon pricing will be be diluted.

Several institutions, including the World Bank, are exploring ways to provide more indirect carbon pricing data to better understand how different pricing incentives apply and interact in the coming years.
Direct carbon pricing is often used in upper-middle-income countries. Developing countries are more suitable for indirect carbon pricing. For example, some African countries have achieved substantial increases in indirect carbon pricing through fuel tax and subsidy reforms.
It is important to note, however, that carbon pricing metrics cannot be used as indicators to achieve climate goals.
Carbon tax and carbon emissions trading system
Direct carbon pricing tools are becoming more common
As of April 2022, there are 68 carbon pricing tools in use globally, and three more tools are under implementation, including 37 carbon tax tools and 34 carbon emission trading tools. Currently, about 23% of global greenhouse gas emissions are controlled by carbon pricing tools.
China has the world’s largest carbon emissions market, and in 2021, China’s National Emissions Trading System completed its first full compliance cycle and reported a compliance rate of 99.5%.
During this cycle, a total of more than 2,100 thermal power plants participated in the trading system. These thermal power plants emit about 4.5 billion tons of carbon dioxide annually, accounting for about 30% of China’s total emissions. Compared with the pricing of other trading systems, the pricing of China’s national carbon emission trading system is relatively low, and the settlement price at the end of the cycle is 54.2 RMB per ton of carbon dioxide emissions.

In 2021, about 179 million tons of carbon dioxide will be traded, and the total transaction settlement price will be 7.7 billion RMB. Of course, for China, the carbon dioxide emissions covered by this trading system are still negligible. China’s carbon emissions trading system is advancing in stages, and currently only entities (non-financial institutions) are allowed to participate in trading.
The overall compliance rate of China’s carbon emissions trading system has reached 99.5%, but there are also huge challenges. For example, the Ministry of Ecology and Environment has confirmed that several companies have falsified carbon emissions data.
The EU carbon emissions trading system is currently the largest trading system in the world, and its trading volume and trading price in both the spot market and the futures market have reached a record high. More than 15 billion carbon emission allowances are being traded on the EU secondary carbon market, and spot prices have nearly tripled from last year.
The European Commission has publicly stated that the EU’s greenhouse gas emissions will be reduced by 55% by 2030, and zero emissions will be achieved by 2050. Achieving this target will require a package of measures, including adding a new, stand-alone carbon emissions trading system that will cover carbon emissions from transport and buildings.
This new carbon emissions trading system will run in parallel with the existing trading system, which covers carbon emissions from electricity and industry.

Absolute coverage of carbon emissions, consumer price index by jurisdiction
The IMO is currently considering market-based measures, including carbon pricing, to reduce greenhouse gas emissions from international shipping. In 2018, the International Maritime Organization announced that it would halve carbon emissions by 2050 through a package of measures, compared to 2008 levels.
The current focus is on medium-term measures, and the IMO has proposed a number of market-based measures, including carbon taxation, cap-and-trade regimes. The carbon tax will apply to marine fuels, starting in 2025 at 100US dollars per ton of CO2 emissions and gradually increasing over a 5-year review cycle thereafter.
The carbon pricing level remains low
Policy-driven, increased market speculation, and rising global energy prices have all driven up the price of direct carbon pricing. But carbon pricing in most jurisdictions is below the targets set by the Paris climate agreement.
In 2021, carbon pricing across multiple ETSs has reached record highs. The European Union, Switzerland, California and Quebec, New Zealand’s carbon emissions trading markets have all reached record prices.
Prices in the UK have increased rapidly since mid-2021. In the Chinese market, carbon pricing fell at the end of 2021 but rebounded in early 2022.
Carbon tax prices have also risen in 2021 and early 2022, at a lower rate than the carbon emissions trading system. The carbon tax is relatively stable in 2020, rising by about 6US dollars per ton of carbon dioxide in 2021, and by 5US dollars per ton of carbon dioxide on April 1, 2022.
Most carbon tax jurisdictions have increased their carbon tax rates compared to last year. British Columbia, Ireland, Latvia, Liechtenstein, South Africa, Switzerland and Ukraine have the highest national carbon tax rates compared to other countries.
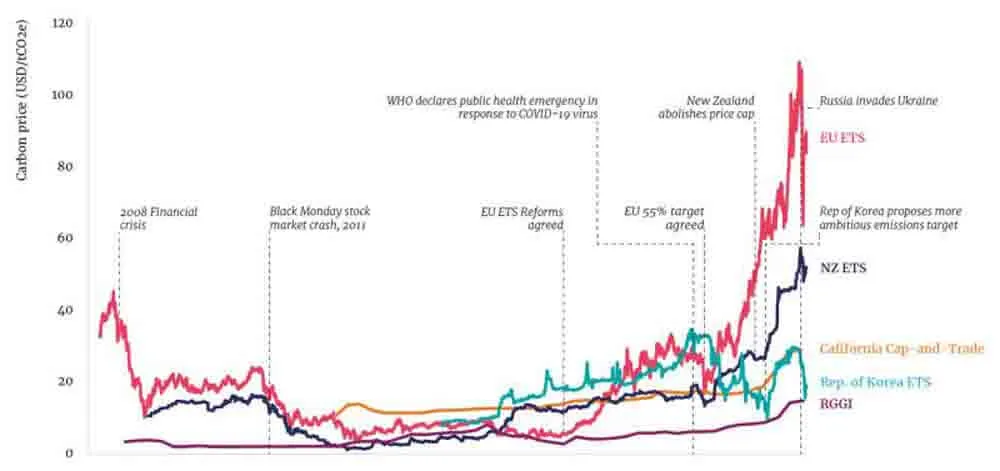
The price trend of carbon emission trading system from 2008 to 2021
Some countries and regions have set more aggressive carbon pricing targets in the coming years. For example, Singapore plans to raise the carbon tax from the current 5 Singapore dollars per ton of carbon dioxide emissions, to 25 Singapore dollars (equivalent to 18 US dollars) in 2024-2025, and 45 Singapore dollars (equivalent to 18 US dollars) in 2026-2027 33 US dollars), rising to 50-80 Singapore dollars (equivalent to 37-59 US dollars) in 2030.
South Africa also plans to increase the carbon tax, from the current 10 US dollars per ton of carbon dioxide emissions, to 20 US dollars in 2026, 30 US dollars in 2030, and 120 US dollars in 2050. Canada also released the latest carbon pricing last year, paying 15 Canadian dollars (equivalent to 12 US dollars) per ton of carbon dioxide, which will increase to 170 Canadian dollars (equivalent to 136 US dollars) by 2030.
Due to the impact of the Russian-Ukrainian war, some countries have also delayed the implementation of their carbon pricing tools. For example, in April this year, Indonesia announced that it would delay the introduction of a carbon tax due to the negative impact of rising energy. Mexico has also announced a carbon tax exemption for gasoline and diesel.
The Covid-19 pandemic has not had a serious impact on carbon pricing and climate targets. The G20’s emissions reduction targets and carbon pricing haven’t been seriously traumatized since the Covid-19 pandemic. Most of these countries’ emission reduction targets were established before the new crown epidemic, and these countries have not delayed emission reduction actions because of the epidemic.
Of course, many countries did take steps that could lead to negative climate impacts, including increasing fossil fuel subsidies and suspending aviation taxes.
Opening the carbon emissions trading system to the non-physical sector (financial institutions) will further affect price movements and increase market volatility. The California-Quebec market in the United States recently opened the trading system to financial institutions, which affected the price fluctuations in the market.

Carbon tax price forecast for six global jurisdictions
Carbon pricing in European markets have reached record highs, and regulations are being developed to circumvent market speculation. In recent years, many investment companies have entered the European carbon market, and the market is worried about double accounting of carbon pricing.
The European Securities and Markets Authority did not find speculative trading in the market, but it did institute a series of measures to increase market transparency. The EU Legislative Council will include some regulations in the reform of the carbon emissions trading system to avoid price manipulation by speculators in the carbon trading market.
Conversely, some jurisdictions want the market to be open to financial institutions to safeguard market liquidity. For example, in 2021, South Korea will open its market to some financial institutions. By December 2021, 20 financial institutions have entered the market, and analysts predict that this will help improve market liquidity once financial institutions become familiar with market transactions.
Carbon pricing revenue is growing rapidly
Carbon revenue has risen sharply in 2021 due to higher carbon pricing, the first time the ETS revenue has exceeded the carbon tax revenue.
International carbon revenue in 2020 is $31 billion, rising to $84 billion in 2021. Carbon revenues in and around the EU, New Zealand, and California contribute roughly 41 percent of global revenue, with the UK and Germany contributing 16 percent.
Notably, China’s National Emissions Trading System allocated all carbon allowances for free in 2021. Therefore, although China is a large carbon emission trading market in the world, the carbon revenue from China is not included in the global carbon revenue this time.

Composition of global carbon revenue from 2016 to 2021
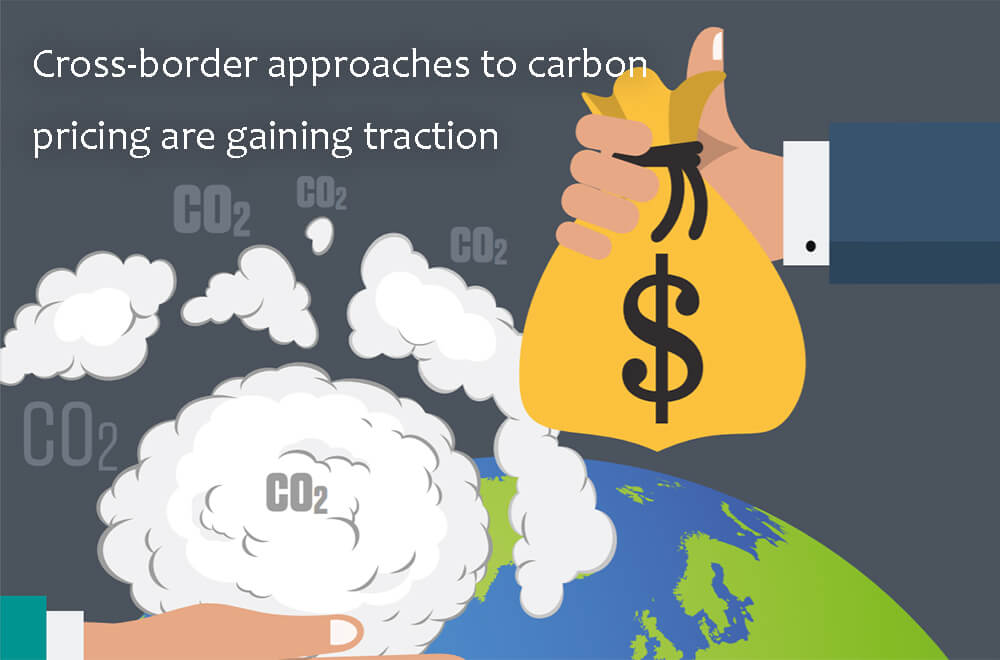
Cross-border approaches to carbon pricing are gaining traction
Countries are looking forward to finding reasonable inter-country trade methods to address the potential carbon leakage caused by rising carbon pricing. Most countries address carbon leakage by providing carbon tax exemptions, credits or free allocation of carbon emission allowances to industries with carbon leakage.
However, these measures also have corresponding drawbacks: reducing the carbon cost signal transmitted through the supply chain does help to level the playing field for imported goods, but also reduces the driving force of the energy transition to low carbon.
In addition, these methods have no practical effect on controlling carbon leakage in the deeper decarbonization process. Therefore, countries are looking for other ways to balance the carbon price of imported goods with the carbon price of goods produced in their own countries.
Cross-border cooperation is one way, such as through the unilateral implementation of carbon border price adjustments, which can impose domestic carbon pricing on imported goods. Implementing the carbon border adjustment mechanism requires a correct assessment of the carbon emissions of imported goods and an understanding of how much carbon tax has been levied in the exporting country before the product is imported.
Of course, cross-border carbon trading could become more feasible if technologies that can optimize current and potential measures of carbon leakage from imported goods are further improved.
Countries have common but differentiated responsibilities for climate change according to their national strengths and historical responsibilities. This principle has long been an important part of international climate cooperation. Developing countries generally believe that if developed countries unilaterally implement carbon border price adjustment strategies on commodities imported by developing countries, it violates the long-established principles of international climate agreements.
At the same time, some countries call on developed countries to be responsible for the carbon footprint of their consumption. In the EU carbon border price adjustment mechanism, it has been proposed that the mechanism should exempt exports from least developed countries, but others believe that such a proposal would reduce the effectiveness of the mechanism.
The compromise proposal is to take part of the revenue from the carbon border price adjustment mechanism and use it to compensate developing countries for losses in the process of carbon reduction. While the EU’s original proposal was to hand most of the revenue to the bloc as fiscal revenue, lawmakers have proposed giving a portion of the revenue to the least developed countries to compensate for the cost pressure the mechanism would put on them.
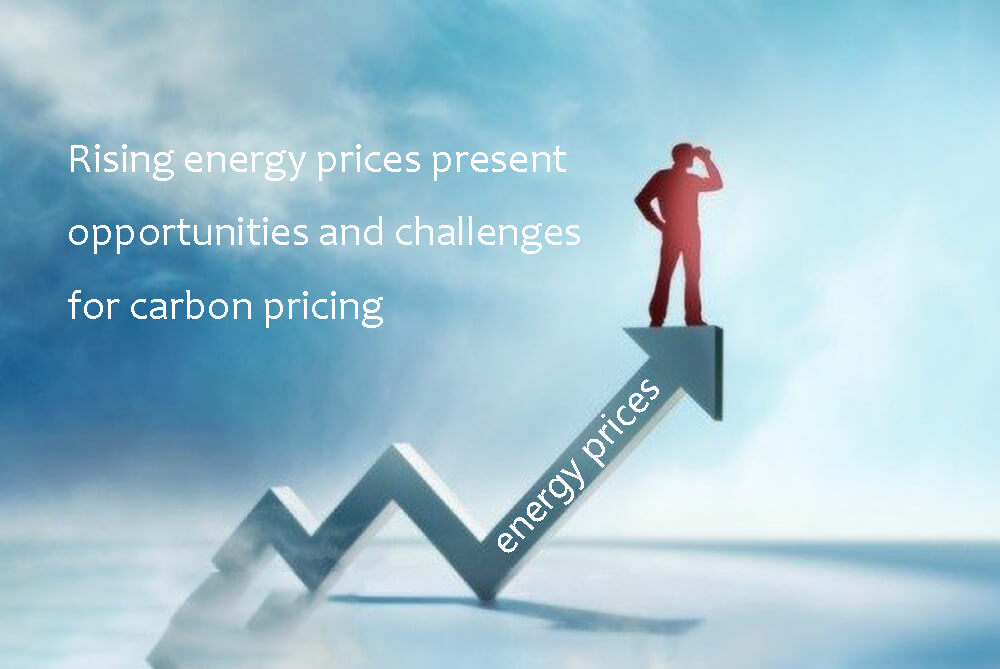
Rising energy prices present opportunities and challenges for carbon pricing
The new crown epidemic and the Russian-Ukrainian war have all contributed to further increases in global oil and natural gas prices. European natural gas prices have reached an all-time high, and global oil prices have also reached their highest in nearly a decade.
The European Union’s decision to phase out its dependence on Russia for gas and oil has also pushed up gas prices further. The sudden rise in energy prices and corresponding inflation has put financial pressure on EU governments.
Governments need to protect consumers and low-income households from energy bottlenecks caused by rising energy prices by regulating or capping energy prices, introducing subsidies or removing surcharges. But any direct reduction in energy prices would reduce the incentive to cut emissions.
The current political and economic environment presents opportunities and challenges for carbon pricing. For countries with high fuel price sensitivity, rising carbon pricing will put excess price pressure on citizens and businesses already bearing high energy prices.
In the short term, high energy prices can lead to reduced energy use. The government will consider developing the country’s renewable energy in the long run because it wants to reduce its dependence on imported energy. Resistance to rising energy prices is especially strong when it is seen as affecting vulnerable groups.
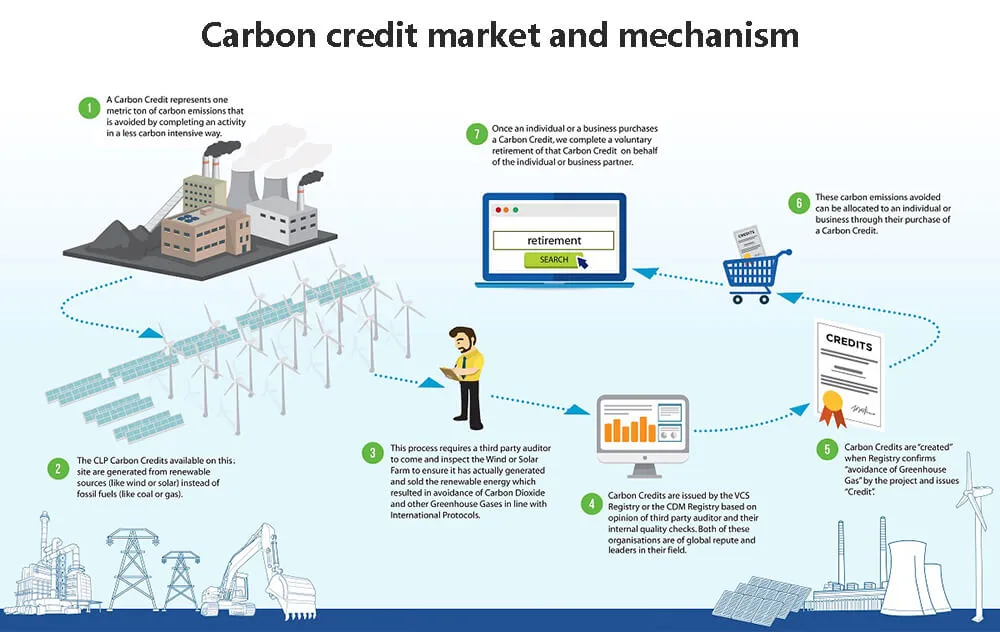
Carbon credit market and mechanism
The carbon credit market is at a crossroads. Strong voluntary demand and expanding market diversity, manifested through new buyers, market niches, trading infrastructure, and unique pricing and preferences, have driven carbon credit market dynamics over the past year. At the same time, as the market grows, the role of carbon credits in meeting carbon emissions targets will come under greater scrutiny.
To sustain current market growth, market players will need to collaborate with each other to support high standards, protect environmental integrity and credibility, and deepen market liquidity. Government ministries, financial services, and new technological infrastructure will all provide support to expand the market size and maintain market integration.
Voluntary market activity brings rapid growth of carbon credit market
In 2021, the carbon credit market will grow by 48%. Carbon credits generated by international, national and independent credit mechanisms increased from $327 million in 2020 to 478 million US dollars in 2021. This is the fastest growth rate since 2012. Since 2007, the cumulative trading scale of the carbon credit market has reached 4.7 billion tons of carbon dioxide equivalent.
In April 2022, the volume of transactions in the voluntary carbon market reached $1.4 billion. The rapid growth in market volume and value reflects a combination of rising prices and increased demand from corporate buyers. The global average carbon credit price will increase from 2.49 US dollars per ton of carbon dioxide equivalent in 2020 to 3.82 US dollars in 2021.
At the same time, companies are increasingly using carbon credits to meet the goals of climate agreements, while market participants and investors are also looking to gain more from rising market prices. The combination of the two together supports market appreciation and increased liquidity.
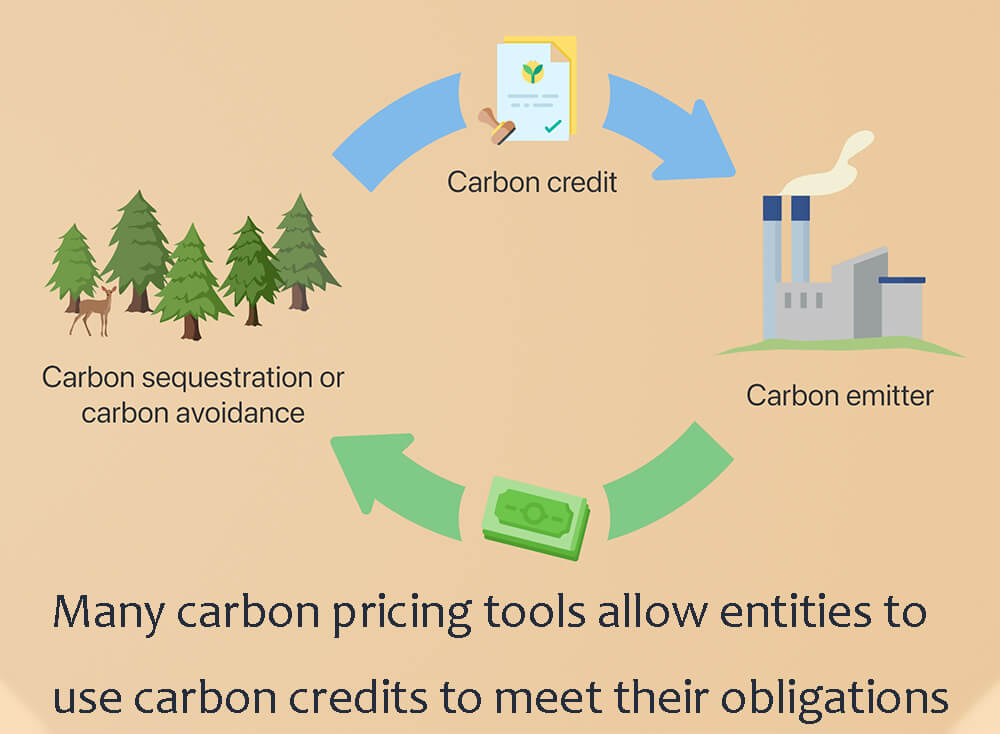
Many carbon pricing tools allow entities to use carbon credits to meet their obligations. Many jurisdictions set up their domestic credit mechanisms to impose carbon taxes or develop carbon emissions trading system mandates.
Changes to some ETS rules, such as capping the state of California and excluding credits from the Swiss ETS and the EU ETS from 2021, will reduce the need for carbon credits.
Voluntary commitments by businesses are key drivers of market growth
Voluntary corporate climate targets continue to be a major driver of carbon credit market growth. These goals should aim to decarbonize within a company’s own value chain while compensating or neutralizing residual emissions. However, plans to achieve these goals vary in coverage, timelines and intended use of carbon credits.
Growing corporate net-zero commitments are driving demand for voluntary carbon markets. The main players in the carbon credit market in 2021 are energy companies (mainly oil and gas companies), which are the main buyers of the carbon credit market, and their purchases are nine times higher than in 2020. Food, beverage and travel companies are also major buyers. Financial companies have also stepped up their carbon credit purchases.
The company’s resources purchase carbon credits to meet its set climate goals to offset its carbon emissions. According to statistics, the carbon credit trading volume of the world’s top 500 companies in 2021 will increase by 17% compared with 2020. The International Air Transport Association recently announced that the aviation industry will achieve a net-zero emissions target by 2050.

Due to the lack of global standards, companies set climate goals that vary widely in scope, emissions, timeframes, and more. This has led some companies to over-rely on carbon credits to meet their climate goals. If the world is to achieve net-zero emissions by 2050, companies must first seek to decarbonize through emission reductions or neutralization, and then consider the remaining carbon emissions through the carbon credit market.
The company’s net-zero emissions target has led to a rapid increase in the demand for carbon credits. A recent report predicts that the annual carbon dioxide emission reduction will reach 1.5-2 billion tons in 2030 and 7-13 billion tons in 2050.
Differences in buyer preferences lead to uneven development of the carbon credit market
Demand preferences and buyer demand continue to incentivize a range of carbon credit alternatives, with differentiated prices by project type, geography, and co-benefits. One of the highlights this year has been increased interest in forest- and land-use-based credit.
Although there have been some moves to provide standardized contracts in recent years, carbon credit prices vary widely, with contracts offered by trading platforms representing credits from different industries. For example, an assessment by S&P Global Platts shows that the pricing of credits based on the removal of carbon emissions is higher than the pricing of credits based on renewable energy projects.
Projects in Asia, Latin America and the Caribbean dominate the carbon credit market. According to Ecosystem Market Realities, Asian projects doubled in 2021 and accounted for 56% of the overall market credit transactions.
Although the Asian carbon credit market has the lowest price, its price is still increasing, from 1.6 US dollars per ton of carbon dioxide equivalent in 2020 to 2.97 US dollars in 2021. Deals in Latin America and the Caribbean accounted for 22% of the total, with the main projects being land and forestry projects. African projects accounted for 15% of the total and were priced at 6.09 US dollars per ton of carbon dioxide equivalent.

Market differentiation is widening, driven by different preferences and needs of buyers. In addition to greenhouse gas emissions, the market will focus on other carbon credit transactions and develop various carbon credit tools. For example, participants will look at whether some common interests and foundational projects contribute to one or more of the SDGs.
Credits with SDG benefits are attractive to buyers because they offer the opportunity to make additional contributions to sustainable development and allow these contributions to be recognized in the social and economic agenda. From a project developer’s perspective, these credits increase the market price premium potential.
New financial services and technologies are entering the carbon credit market
There will be a rapid increase in financial players in the market in 2021. These new players provide the market with many new services, such as trading platforms, financial derivatives and carbon quality standards.
By introducing new pricing mechanisms, the nature of transactions has been fundamentally changed. Pricing in standard contracts is used for market benchmark prices, companies price assessments for different types of carbon credits, and combined auctions of carbon credits have emerged.
New market players and financial institutions drive the carbon credit market toward standardization, which brings both opportunities and challenges to the market.
Standard contract transaction data is sparse and fragmented, making market pricing more difficult to assess. While over-the-counter trading remains the norm in the carbon credit market, available indicators suggest that the number of standardized transactions has grown significantly in recent years.
The development and dissemination of new technologies, especially blockchain-related technologies, is reshaping the way carbon credit markets are traded. For example, decentralized finance is a mainstream application of blockchain technology in the market in recent years.

Decentralized finance allows peer-to-peer financial transactions without third parties through cryptocurrencies, smart contracts and other digital technology innovations. The deployment of these new technologies can help expand the carbon credit market while providing traceability, liquidity, security and transaction efficiency.
Under the “dual carbon” goal, The zero-carbon transformation of China’s power battery industry chain has significantly accelerated, related companies in Top 5 power battery zero carbon company in China.