Skip to content


In terms of overall scale, the new installed capacity in 2030 is expected to exceed 70GW. It can be seen that under the expectation of the future development of renewable energy and the continuous transformation of energy structure, countries around the world are paying more and more attention to energy storage.
It is estimated that in 2025, the cumulative global capacity based on power output will reach nearly 150GW, and until 2030, benefiting from the energy storage demand in China, the United States, Europe and other regions, the capacity of energy storage systems will increase by 15 times, reaching 411GW.

New installed capacity of global storage energy capacity(GW)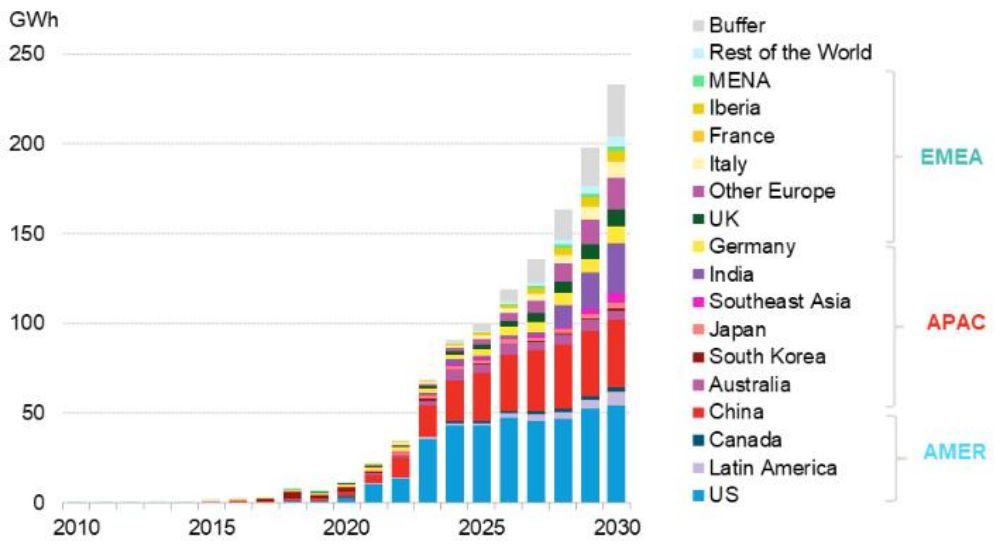
Global storage energy capacity newly added power generation(GWh)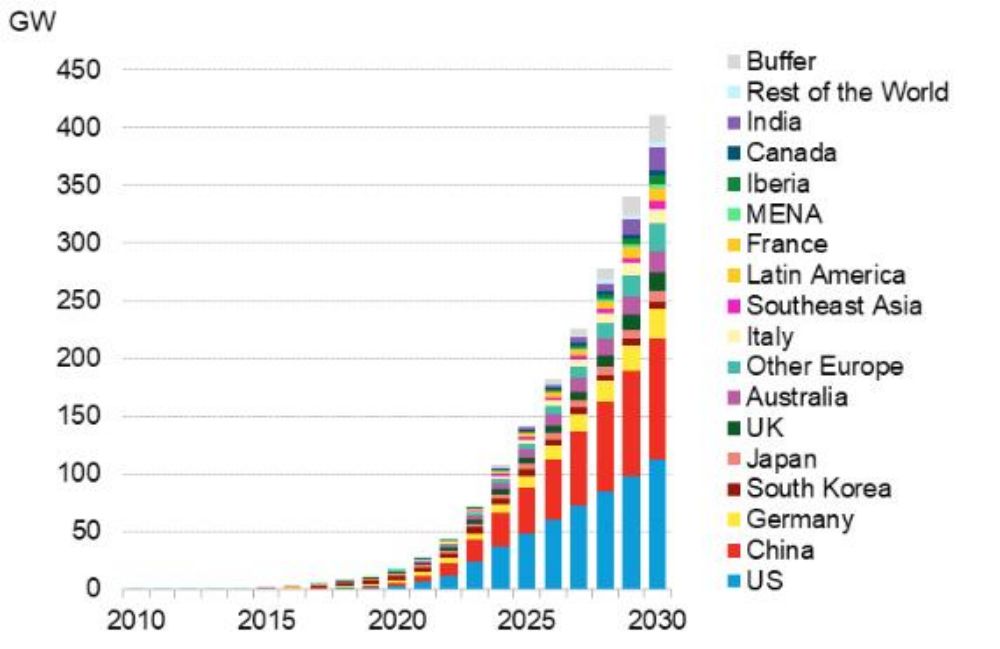
Global cumulative installed capacity of storage energy(GWh)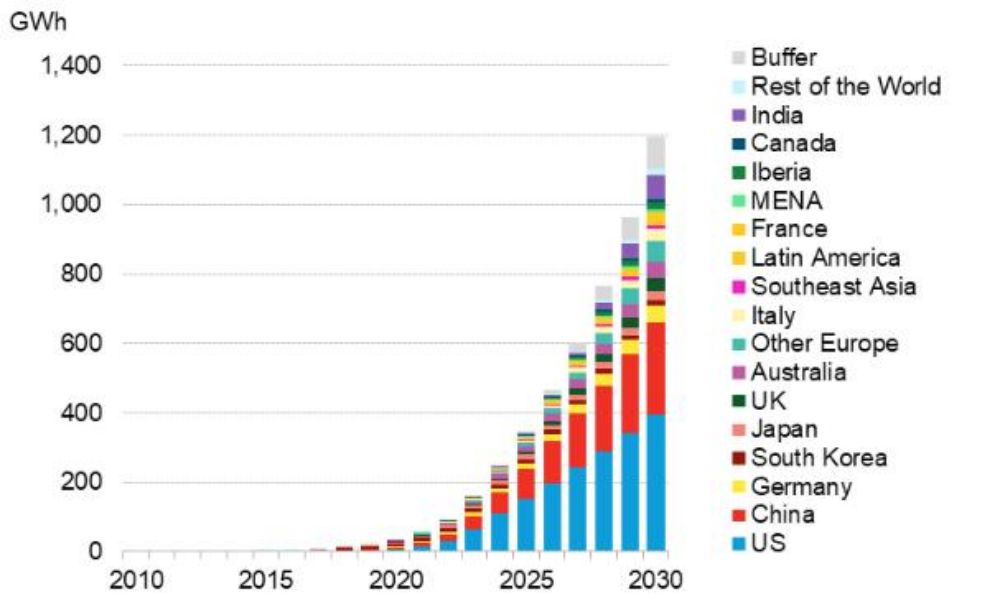
Cumulative global power generation(GWh)
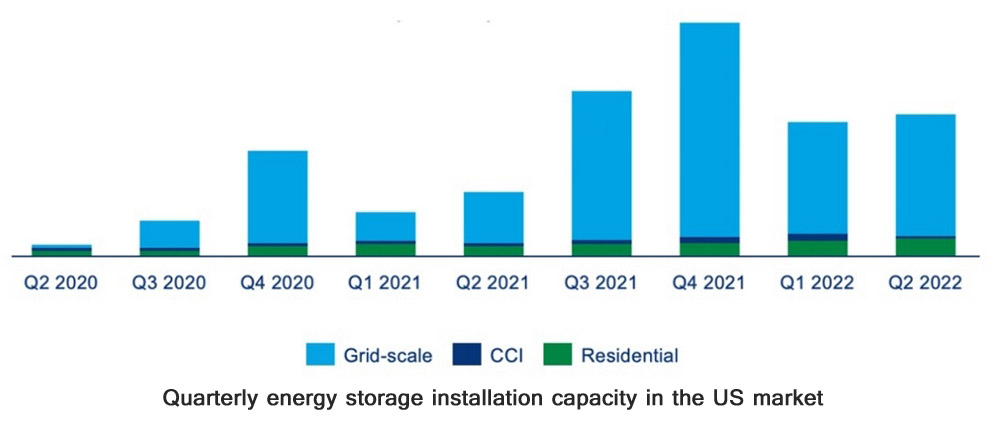
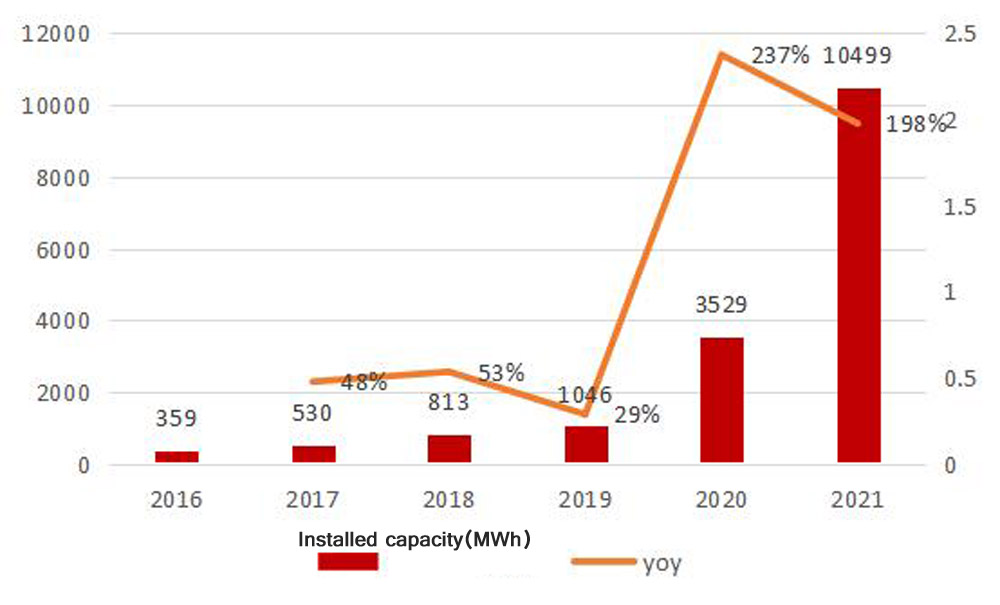
US energy storage is developing rapidly, and GW-level storage energy capacity is installed every quarter. Starting from 2020, the US energy storage market has entered a period of rapid growth. In 2020 and 2021, the installed capacity of US energy storage will reach 3529/10499MW respectively, with a growth rate of 237%/198%.
According to the research report “US energy energy Monitor”, in the first half of 2022, the installed capacity of the US energy storage market will be 2305MW/5917MWh, Among them, the installed capacity of grid-level storage energy in 22Q2 reached 1,170 MW/2,608 MWh, the highest installed capacity in the second quarter ever.
Analysis of energy storage market in US
The regional differentiation of the US energy storage market is obvious, mainly concentrated in California and Texas. As of 2021, the installed capacity of storage energy in California is 2339.1MW, accounting for 44%; the installed capacity of storage energy in Texas is 797.4MW, accounting for 15%. The rapid development of California and Texas is mainly related to factors such as unstable power infrastructure and obvious policy incentives, which will be elaborated later.
 Number of grid-connected storage energy projects by state
 New installed capacity of US energy storage
Classification of US energy storage application scenarios
According to the classification of application scenarios, US energy storage is dominated by front-end (power generation side, grid side), and 22H1 will contribute more than 80% of the share. At present, due to the marketization of electricity in the U.S. market, each power grid system is relatively independent, and it is difficult to carry out large-scale cross-region dispatching.
Therefore, power auxiliary services are needed to help complete consumption, and the installed capacity of generation side, grid side storage energy has increased significantly. Household storage energy has installed capacity of 393MWh in 21 years. Although the proportion is small, it is still in the early stage, and the subsequent growth rate will accelerate.
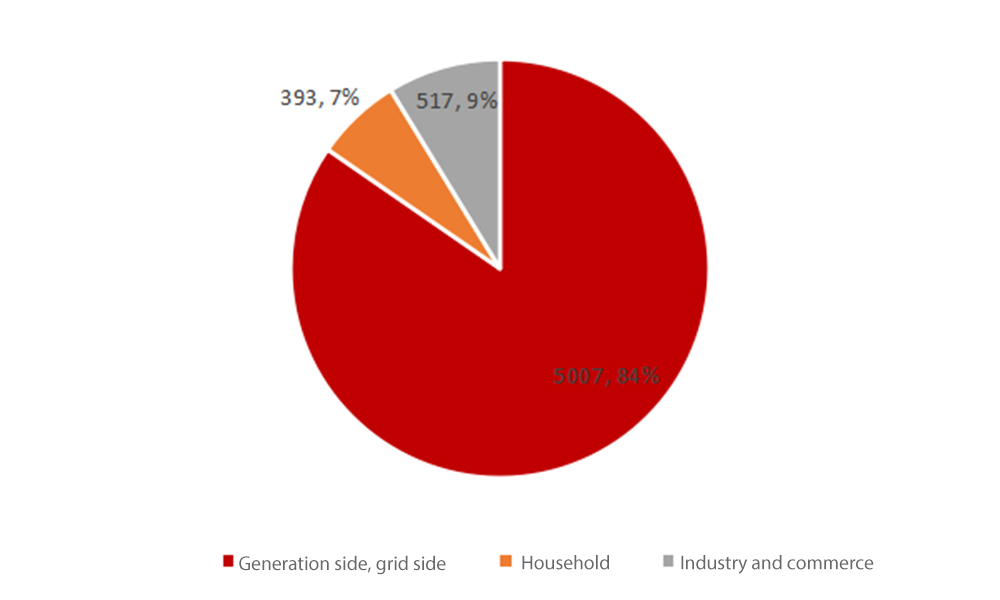
2022H1 US storage energy installed capacity(classified by application scenarios, MWh)
Types of US energy storage technologies
In terms of technology types, the project structure is diverse, the number of electrochemical storage energy projects is large, and the installed capacity of pumped storage is large. Current key storage energy technologies include pumped hydro energy storage (PHS), compressed air energy storage (CAES), advanced battery energy storage (ABES), flywheel energy storage (FES), thermal energy storage (TES) and hydrogen energy storage (HES). Wait.
From the perspective of the number of projects, the current US energy storage projects are classified by technology type. Electrochemical projects account for about 64% of the total, while thermal energy storage accounts for 25%, and pumped storage and electromechanical storage energy account for about 10%. From the perspective of installed capacity, pumped storage accounts for 92% of the total installed capacity, which is about 27GW, and the scale of the rest is less than 1GW.
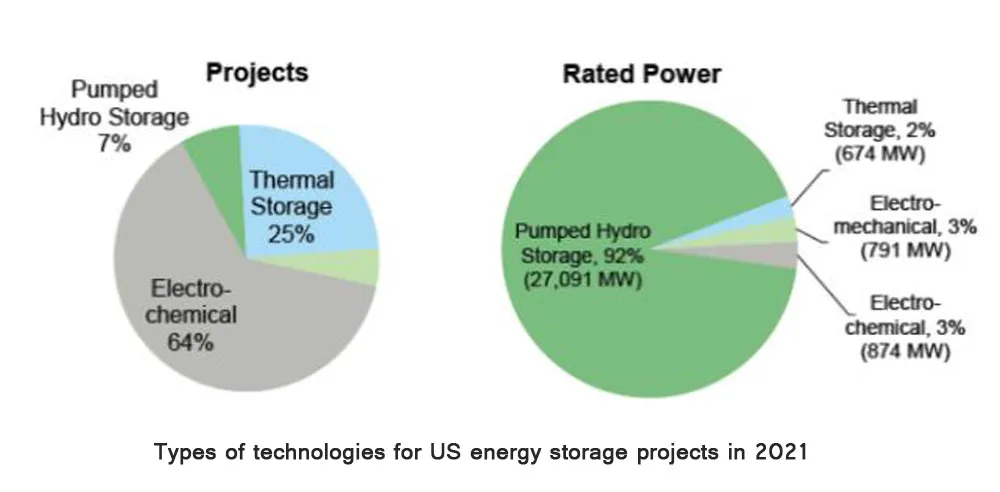
Types of technologies for US energy storage projects in 2021
The market penetration rate is about to increase, and the CAGR of large deposits/household deposits is expected to be 94%/86% in 21-25 years. After calculation, it is estimated that 50.22, 57.83, 70.79, and 89.75 GWh of new photovoltaic + wind power installed capacity will be added in the United States in 22-25, corresponding to the charging and discharging time of 2, 2, 2.5, 2.5, and 3 hours, and the penetration rate of storage energy will be 10%, 12%, 18%, and 25%. , 32%.
The storage energy ratio is 45%, 50%, 55%, 60%, and 65%, and the calculated incremental power generation installed capacity corresponding to the installed energy storage is 6.03, 14.31, 26.55, and 56.00GWh respectively; It is estimated that the unallocated photovoltaic + wind power installed capacity in the United States in 22-25 years will be 66.33, 106.13, 148.58, 193.15GWh, corresponding to the charging and discharging time of 2, 2, 2.5, 2.5, 3h, and the energy storage penetration rate of 5%, 5%, 7%, 8%, 10%.
According to calculations, the corresponding storage energy installations for incremental power generation installed capacity are 6.63, 18.57, 29.72, and 57.95GWh respectively. It is estimated that the total installed capacity of US energy storage market in 25 years will reach 113.95GWh, and the CAGR in 21-25 years will be as high as 94%.
Forecast of large storage capacity in the United States
| 2021 | 2022E | 2023E | 2024E | 2025E | |
| New PV installations in the United States(GW) | 26.30 | 31.56 | 37.87 | 49.23 | 66.47 |
| New wind power installations in the United States(GW) | 17.60 | 18.66 | 19.96 | 21.56 | 23.28 |
| New photovoltaic + wind power installations in the United States(GW) | 43.90 | 50.22 | 57.83 | 70.79 | 89.75 |
| Storage permeability(%) | 10% | 12% | 18% | 25% | 32% |
| Storage ratio(%) | 45% | 50% | 55% | 60% | 65% |
| Charge and discharge time(h) | 2 | 2 | 2.5 | 2.5 | 3 |
| Incremental power generation installed capacity corresponding to installed storage energy(GWh) | 3.95 | 6.03 | 14.31 | 26.55 | 56.00 |
| U.S. stock unallocated photovoltaic + wind power installed capacity(GW) | 40.20 | 66.33 | 106.13 | 148.58 | 193.15 |
| Storage permeability(%) | 5% | 5% | 7% | 8% | 10% |
| Charge and discharge time(h) | 2 | 2 | 2.5 | 2.5 | 3 |
| Stock power generation installed capacity corresponding to installed storage energy(GWh) | 4.02 | 6.63 | 18.57 | 29.72 | 57.95 |
| Total new installed capacity of storage energy(GWh) | 7.97 | 12.66 | 32.89 | 56.26 | 113.95 |
In terms of household storage, it is estimated that the new household photovoltaic installations in the United States will be 4, 5, 8, 11, and 16GW in 22-25, and the penetration rates of new household photovoltaic distribution and storage will be 17.4%, 21.7%, 27.7%, and 32.6% respectively, corresponding to newly added household storage and installed capacity are 2, 4, 7, and 12GWh respectively, and the CAGR in 21-25 years is as high as 86%.
Large storage capacity forecast in the United States
| 2021 | 2022E | 2023E | 2024E | 2025E | |
| Number of single-family houses in the United States (thousands of households) | 9000 | 9450 | 9923 | 10419 | 10940 |
| Single household installed capacity (kwh) | 16 | 16.8 | 17.6 | 18.5 | 19.4 |
| Total market space of U.S. household storage installed capacity (GWh) | 1440 | 1588 | 1746 | 1927 | 2122 |
| Cumulative installed capacity of U.S. household storage (GWh) | 3 | 5 | 9 | 16 | 28 |
| Cumulative penetration rate of US household Savings (%) | 0.2% | 0.3% | 0.5% | 0.9% | 1.3% |
| New household storage and installed capacity in the United States (GWh) | 1 | 2 | 4 | 7 | 12 |
| Y-o-Y | 53.8% | 100.0% | 75.0% | 71.4% | |
| U.S. New Residential Photovoltaic Installed Capacity (GW) | 4 | 5 | 8 | 11 | 16 |
| Penetration rate of newly added household photovoltaic distribution and US energy storage (%) | 14.1% | 17.4% | 21.7% | 27.7% | 32.6% |
Driving factors of the US energy storage explosion
The stability of the power system is poor. The power supply stability of the power system in the United States is poor. In extreme weather, it is easy to cause the power supply system to fail to operate normally. Therefore, storage energy is needed to solve the security problem of power system operation. The main reasons for the poor power supply stability of the power system are as follows:
1) Privatization of the US power grid. In 1998, the U.S. government liberalized retail electricity prices, and U.S. electricity prices began to be determined by the market. As a result, many interest groups poured in, and private enterprises went their separate ways. When encountering extreme weather, what these enterprises think of is not trying to maintain the supply of electricity and raising prices, which greatly limits the development of the power system.
2) The three major power grid systems in the United States are relatively independent. The US energy storage is currently mainly composed of three major power grid groups: the Eastern Union Grid, the Western Union Grid, and the Texas Power Grid. Because the UHV technology in the United States has not been widely used, and the distance is too long and the loss is too large, the power grid groups are unwilling to carry out power transmission between states, so they operate independently and it is difficult to carry out large-scale cross-regional dispatch.
3) Outdated and messy grid system. Since the U.S. power grid has been laid out for a long time, the line layout is relatively complicated. In the context of power privatization, companies are unwilling to invest too much money in upgrading and maintaining the power grid system, which leads to the gradual aging of equipment, and power outages are prone to occur when encountering slightly extreme weather.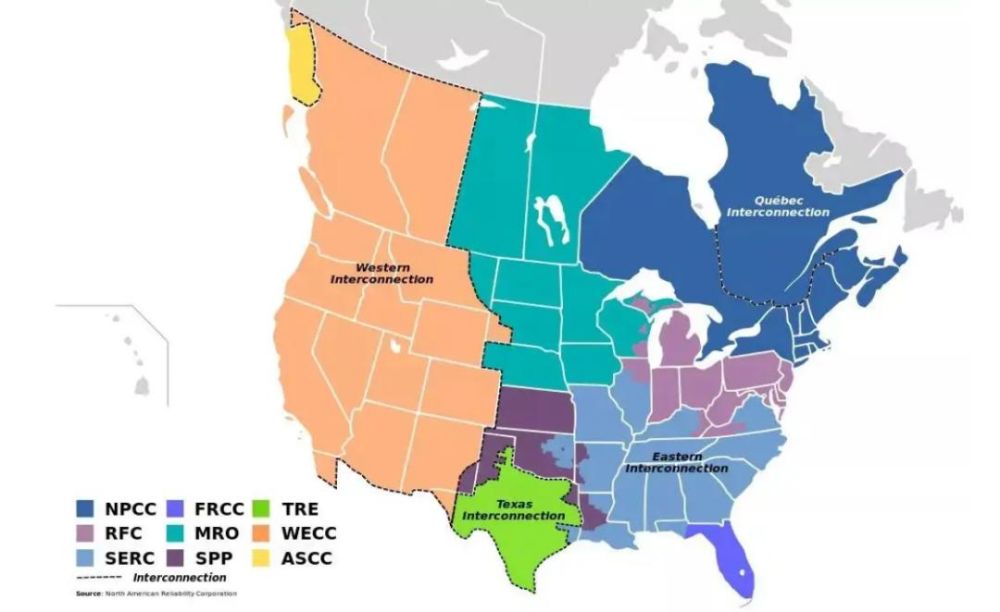
High electricity prices, widening peak-to-valley price gap, and accelerated grid integration of new energy sources. In recent years, electricity prices for American residents have been high, rising from 12.69 cents/KWh at the beginning of 21 to 15.19 cents/KWh in November 22, an increase of 19.7%. At the same time, due to the liberalization of the electricity market in most regions, the electricity price difference is relatively large. Assuming 15 kilowatt-hours of home storage, the annual economic income is about 800 US dollars, superimposed on storage subsidies, which greatly stimulates the demand for home storage.
IRA bill tax credit policy
Before the introduction of RA, the ITC policy was that photovoltaic projects that started construction in 2022 and came online before the end of 2025 were eligible for a 26% credit; projects that started construction in 2023 and went online before the end of 2025 received 22%; Items get 10%. Standalone storage energy is not eligible for credits.
After the introduction of the IRA, the personal income tax credit for storage energy systems connected to photovoltaics was postponed for ten years, and increased from 26% to 30%, and began to drop to 26% in 2033. Alternatively, stand-alone storage energy systems with a capacity of at least 3KWh are also eligible for ITC credits. Benefiting from policy promotion, photovoltaics, wind power, and energy storage have developed rapidly.
The US government has passed an ambitious climate bill in the form of the Inflation Reduction Act (IRA), with major support for wind, solar and storage energy.It is speculated that, benefiting from the IRA bill, from 2022 to 2030, the US energy storage will add an additional 20GW/78GWh of energy storage construction. Among them, Texas added 8.9GW, and California added 6.5GW. It is estimated that by 2030, the cumulative installed capacity of US energy storage will reach 112GW/396GW
Competitive landscape of the US energy storage market
According to the storage energy industry chain from top to bottom, we divide large storage and household storage related participants into five categories: battery suppliers, inverter suppliers, system integrators, project installers and operators.
Among them, the mainstream manufacturers of battery suppliers in China include CATL, BYD, EVE, etc. top 10 lithium ion battery manufacturers; Inverter suppliers include Sunshine, Huawei, Kstar, GoodWe, Jinlong, etc.; system integrators and installers are mainly CATL, BYD, and Sunshine; and operators are mostly local companies.
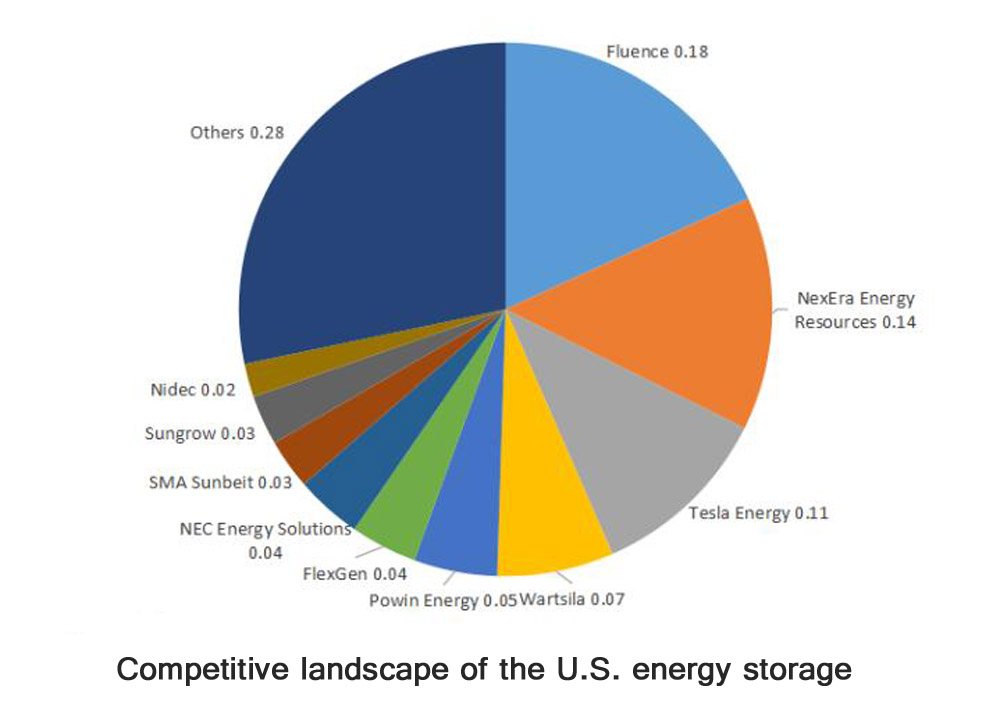
In the U.S. generation side, grid side storage market, integrators are currently the main provider of equipment, and the localization of integration is obvious but relatively scattered. Fluence, NextEra, Tesla, Powin, and FlexGen are the top five integrators, accounting for more than 75%-80%. However, the U.S. integration market has not formed a monopoly.
The top Chinese integrators CATL, BYD, and Sunshine have high brand recognition, strong product stability, and high consistency. They are expected to gain more shares. According to the overall global integrator ranking last year, Fluence’s implemented and planned projects accounted for 18%, NextEra’s 14%, one of top 10 powerwall manufacturers in the world Tesla’s 11%, Powin’s 5%, and FlexGen’s 4%.