Global photovoltaic pioneer, parity ushered in a new starting point
In the world’s major solar pv industry markets, distributed development is faster. The European solar pv industry market is one of the most important solar pv industry markets. It is estimated that in 2021, the installed capacity of photovoltaics in Europe will be close to 30GW, accounting for about 18% of the world’s total. Among them, the EU will have 25.9GW, which is the main force of photovoltaics in Europe.
In terms of types, distributed installed capacity in Europe accounts for about 80%, mainly due to the high degree of overall urbanization and the relatively small area of plains suitable for ground-based power stations, so rooftop distributed photovoltaics have more suitable application scenarios. Related companies can refer to Top 10 grid-scale energy storage countries in Europe in 2022.
Solar pv industry started very early, leading the solar pv industry in the beginning. The European solar pv industry market developed very early, and before 2012, it was the focus of global solar pv industry development on the demand side and the manufacturing side. In 2011, the EU’s photovoltaic installed capacity was 22.3GW, accounting for 77% of the world’s total, second only to 2021 ten years later.
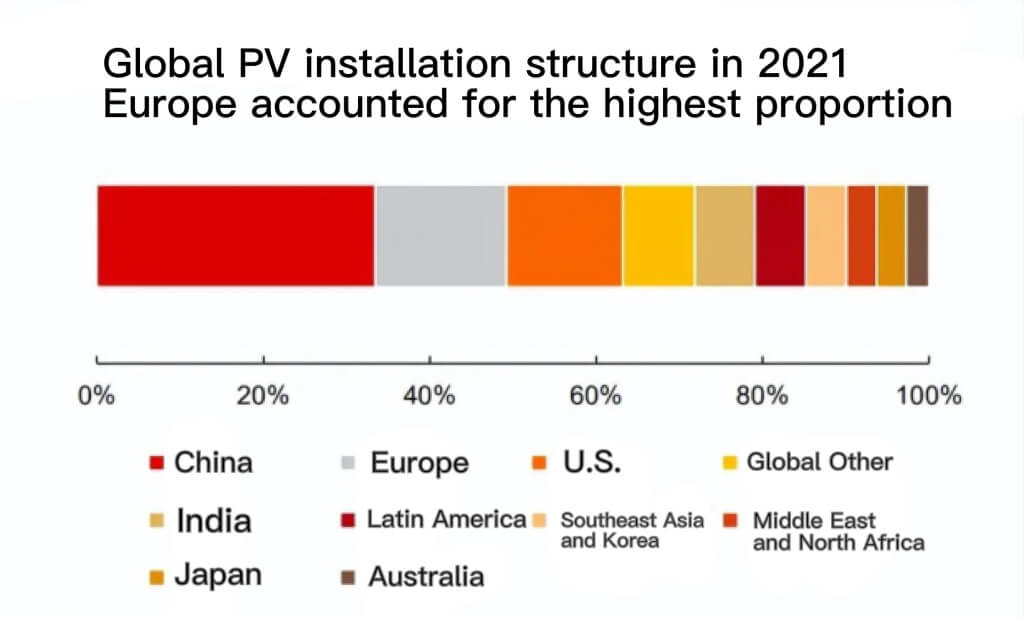
Global PV installation structure in 2021, Europe accounted for the highest proportion
The reasons why the EU developed solar pv industry earlier:
1) On the demand side, the policy is forward-looking. Germany issued the Renewable Energy Law (EEG2000) in 2000 to encourage the grid connection of renewable energy. In 2004, EEG2004 and various photovoltaic financial subsidy policies were launched;
2) On the manufacturing side, as a semiconductor-like solar pv industry, photovoltaics have a manufacturing foundation in Europe, where semiconductor technology is developed. In the early years, European solar pv industry companies covered all aspects of the industrial chain and flourished for a while.
Today, silicon material companies Wacker, inverter companies SMA and Fronius, which are still active in the global solar pv industry market, are also headquartered in Europe.
Policies and costs are both drivers and restraints for the European solar pv industry market. In July 2012, European local manufacturers filed an investigation application with the European Commission against China’s dumping of solar pv industry products, provisions for the imposition of anti-dumping and countervailing duties on products that do not reach the Minimum Import Price (MIP).
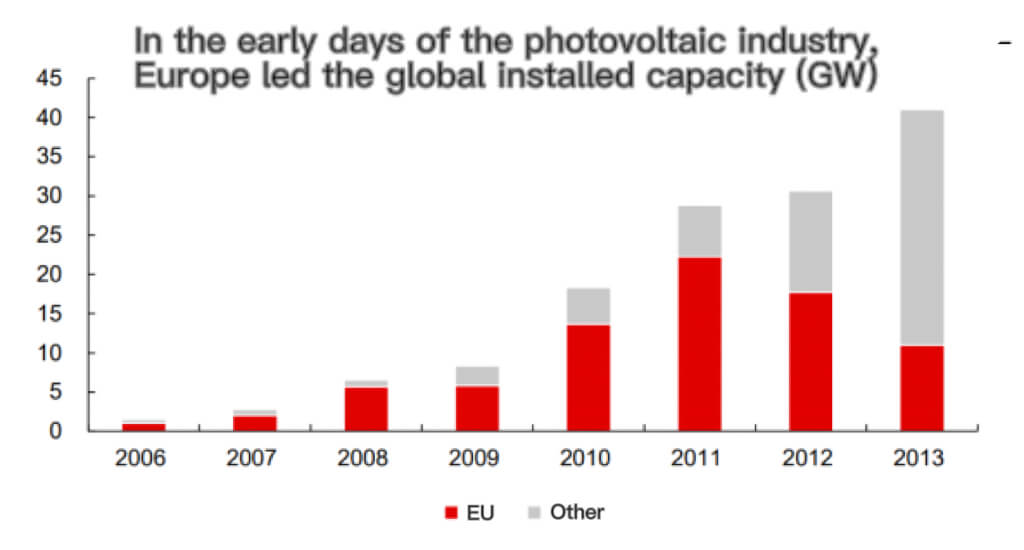
In the early days of the solar pv industry, Europe led the global installed capacity
From 2013 to 2017, the anti-dumping and MIP policies restricted the export of Chinese photovoltaic modules to the EU, and caused the installation cost of the European solar pv industry market to be higher than the solar pv industry, and the installed capacity demand entered a downturn. At this stage, the newly installed photovoltaic capacity in Europe is only 6-11GW each year.
The policy cycle stimulates cost reductions, and Europe, where electricity prices are relatively higher, is the first to enter a new starting point for parity in 2019. In 2018Q4, China experienced “531”, resulting in a continuous drop in module prices;
At the same time, on September 3, 2018, the EU officially ended the double-reverse and MIP policies for Chinese PV companies. At that time, the MIP price of modules was 21%-30% higher than the price in China. Since then, European PV has officially entered the era of parity.
The EU installed 16.7GW in 2019, a year-on-year increase of 104%. In 2021, Europe will achieve an installed capacity growth rate of over 30%, showing strong demand resilience under the influence of the epidemic.
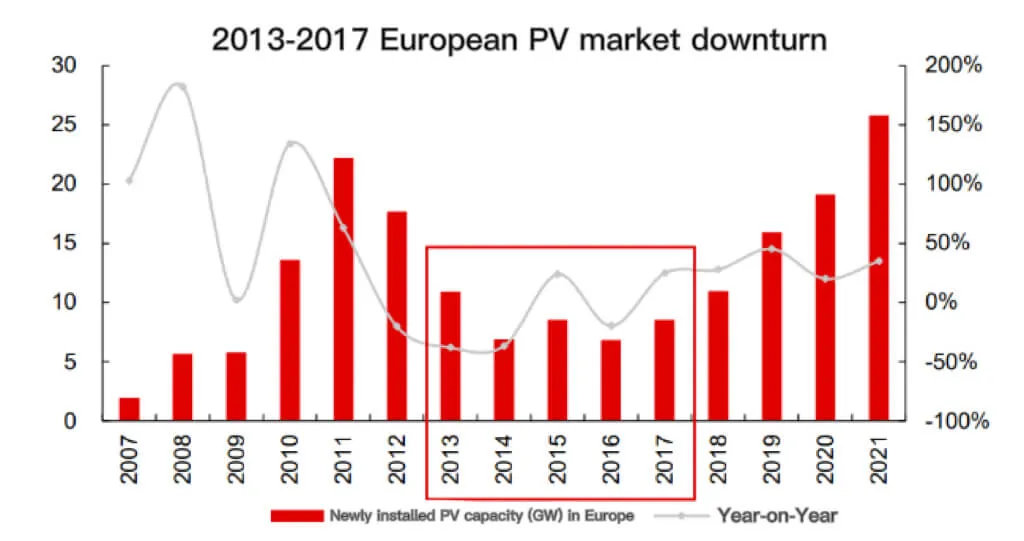
2013-2017 European solar pv industry market downturn
Below, we analyze the underlying logic of demand resilience, look forward to the development of the European solar pv industry market, and look for investment opportunities for Chinese solar pv industry companies
Forward-looking emission reduction + energy security needs to enhance demand resilience
We believe that the European solar pv industry market has two core differences that lead to stronger demand resilience compared to other solar pv industry markets:
1) Higher awareness of carbon emission reduction. The EU’s double carbon progress is ahead of the world, and it is inseparable from the full support of policies. Since 2018, the emission reduction target has been gradually tightened. Under the guidance of reducing carbon emissions by 55% in 2030 compared with 1990, the new energy power solar pv industry development plan has also been refined layer by layer.
Under the accelerated scenario, the EU’s cumulative PV installed capacity will exceed 1,000GW in 2030, and by 2025, the newly installed capacity will reach 112GW, with a four-year compound growth rate of over 40%.
2) The issue of energy security is more prominent. Natural gas is one of the main sources of electricity in Europe, and more than 80% depends on imports.
On the one hand, under geopolitical fluctuations, the EU urgently needs to ensure energy security and develop new energy power solar pv industry to replace traditional energy sources such as natural gas;
On the other hand, the increase in the price of natural gas will eventually lead to an increase in residential electricity prices and photovoltaic PPA prices, which greatly enhances the investment attractiveness of solar pv industry power plants. At the end of 2021, German residential electricity prices and European solar pv industry PPA prices have increased by 319% and 17% year-on-year, respectively.
Forward-looking awareness of carbon emission reduction, policy tightening target raised.
The EU reached its carbon peak in 1990 and aims to achieve carbon neutrality by 2050, leading the world in overall progress. On the one hand, the social and economic development of the European solar pv industry market is more mature, the degree of urbanization is high, and the growth of carbon emissions has tended to be stable.
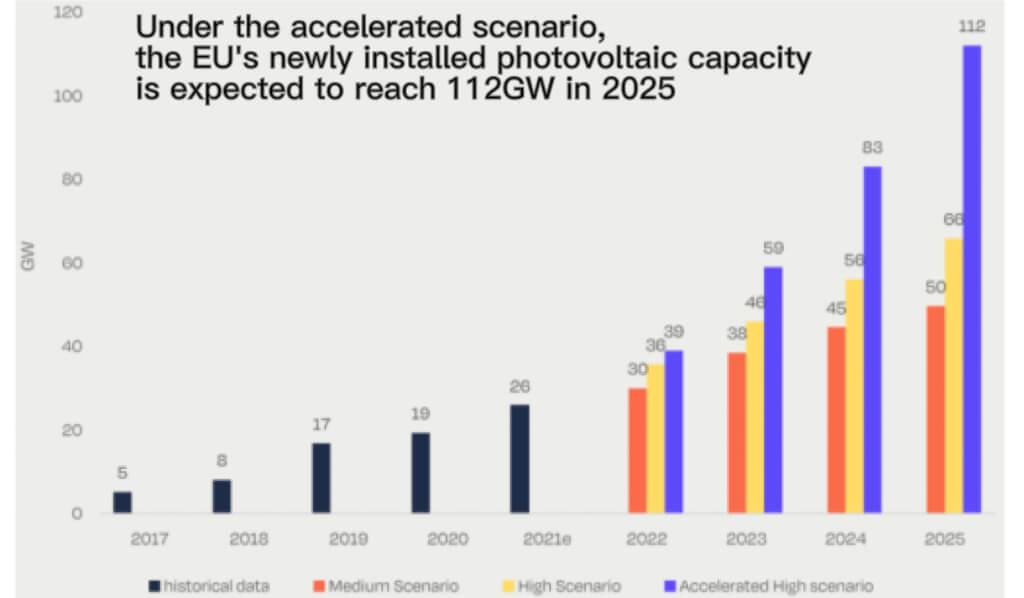 Under the accelerated scenario, the EU’s newly installed photovoltaic capacity is expected to reach 112GW in 2025
Since 2018, the EU’s carbon emission reduction targets have been gradually tightened. Under the guidance of reducing carbon emissions by 55% compared with 1990 in 2030, the new energy power development plan has also been refined.
According to the bill submitted by the European Commission in July 2021, details such as the proportion of renewable energy power and vehicle emission reduction are further tightened.
Among them, the target for the proportion of renewable energy power in 2030 is 40%, reaching the upper limit of the target of 38%-40% proposed in 2020, which is a significant increase from the earliest 32%.
On March 8, 2022, the European Commission issued a plan, once again clearly emphasizing the acceleration of new energy construction, adding 80GW of photovoltaic or wind power installed capacity on the basis of the July 2021 target.
Specifically, from 2021 to 2030, the targets in solar pv industry for new PV and wind power in the EU are 420GW and 480GW respectively. Assuming that 80GW of target wind power and PV account for 50% of the total in solar pv industry, the EU’s annual average PV and wind power are expected to exceed 46GW in the next ten years ( Previously 42GW), 52GW (previously 48GW), a significant increase from 25.9, 11GW in 2021.
 EU carbon trading prices have continued to rise since 2020 (EUR/t)
The EU carbon trading solar pv industry market is also more mature. The EU carbon trading market was established as early as 2005, and the scale of the carbon trading market in 2020 has reached 229 billion euros, accounting for nearly 90% of the global market.
At the same time, the carbon trading price has also continued to rise with the tightening of carbon emission reduction efforts. At the end of December 2021, the carbon price reached 89.24 euros / ton, an increase of 268% compared with the beginning of 2020. The significantly increased green power premium further enhances the willingness of investors and industrial and commercial plant owners to build new energy power plants.
If green electricity is used to replace natural gas electricity, carbon emissions can be reduced by 350-500g per kilowatt-hour of electricity. Under the carbon trading price of 80 euros/ton, it is equivalent to the green electricity premium of about 0.03-0.04 euros/kWh. According to our estimates, there is no subsidy, etc. Under the preferential policy conditions, it is equivalent to increase the IRR by about 0.2pct, which can offset the increase in module prices of about 0.05-0.08 yuan/W.
In addition, the EU carbon tariff is also ahead of the global launch, reflecting Europe’s firm belief in new energy. On March 15, the EU Carbon Tariff Act (CBAM) was passed by the EU Council.
The bill imposes tariffs on the direct carbon emissions of imported goods from industries including cement, electricity, fertilizers, steel and aluminum.
We believe that the reason why the EU proposed a carbon tariff bill is to make imported products bear the same carbon emission cost as products produced in the EU. Looking further, it reflects the EU’s overall emphasis on carbon emission reduction.
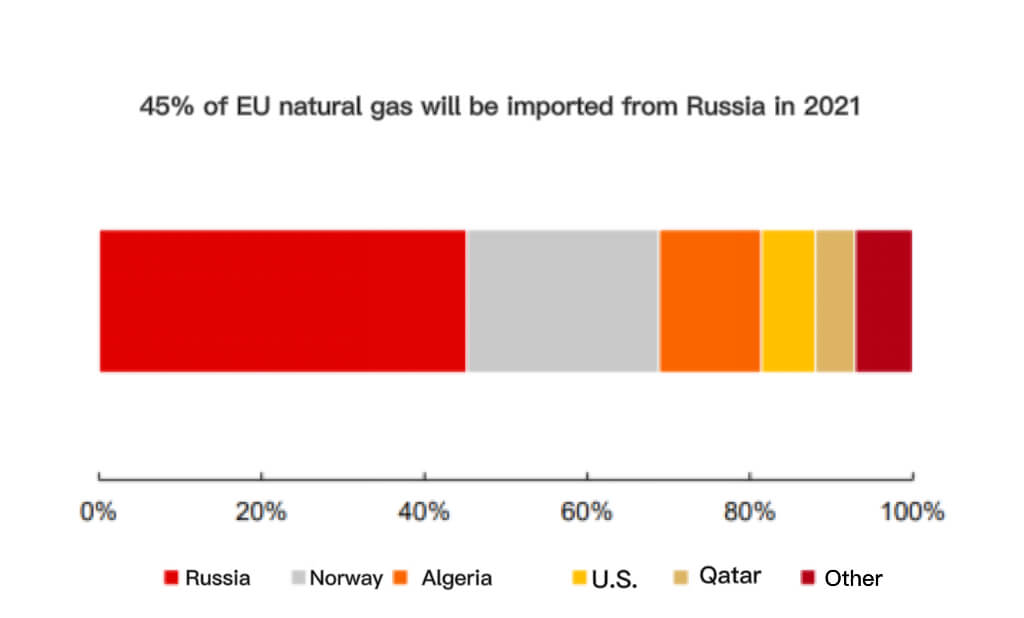 45% of EU natural gas will be imported from Russia in 2021
The issue of energy security is prominent, and the economy of new energy is prominent
Compared with other solar pv industry markets, the issue of energy security in Europe is more prominent, further enhancing the willingness to develop new energy solar pv industry. Europe is highly dependent on external energy sources. Natural gas power is one of its important power sources, accounting for more than 20%, while more than 80% of natural gas depends on imports, of which about 40% depends on Russia. Due to political factors, Russia’s natural gas exports to the EU have been decreasing year by year in recent years, resulting in increasingly prominent energy security issues.
Against the background of natural gas shortage, electricity prices in the EU continued to rise. For example, in Germany, the electricity price in December 2021 exceeded 220 euros/MWh, a year-on-year increase of 319%.
Under the situation of Russia and Ukraine, the relationship between the EU and Russia has become tense again. We expect that electricity prices will be difficult to fall in 2022. On the one hand, it stimulates the government to find other energy alternatives to natural gas, so as to ease the pressure on natural gas supply, on the other hand, it stimulates the development of new energy power on the demand side and expands the economic advantages of distributed photovoltaics.
In the past two years, the price of electricity has risen and the price of the solar pv industry chain has continued to rise, and the price of photovoltaic PPA in the EU has also continued to rise. In 2021Q4, the EU PV PPA price reached EUR 47.97/MWh, a year-on-year increase of 16.7% and a month-on-month increase of 7.2%.
At the same time, the PPA agreement cycle also tends to shorten. Previously, the term of PPA contracts was mostly years, and contracts of 8-10 years have become more common in the past two years. Under the fluctuation of supply and demand, the price of PPA has become more flexible, ensuring that the return rate of power plant investors remains good.
It is estimated that if there are no preferential policies such as subsidies and the component price remains unchanged, for every 0.01 euro/kWh increase in the PPA price, the corresponding IRR can be increased by about 0.4pct.
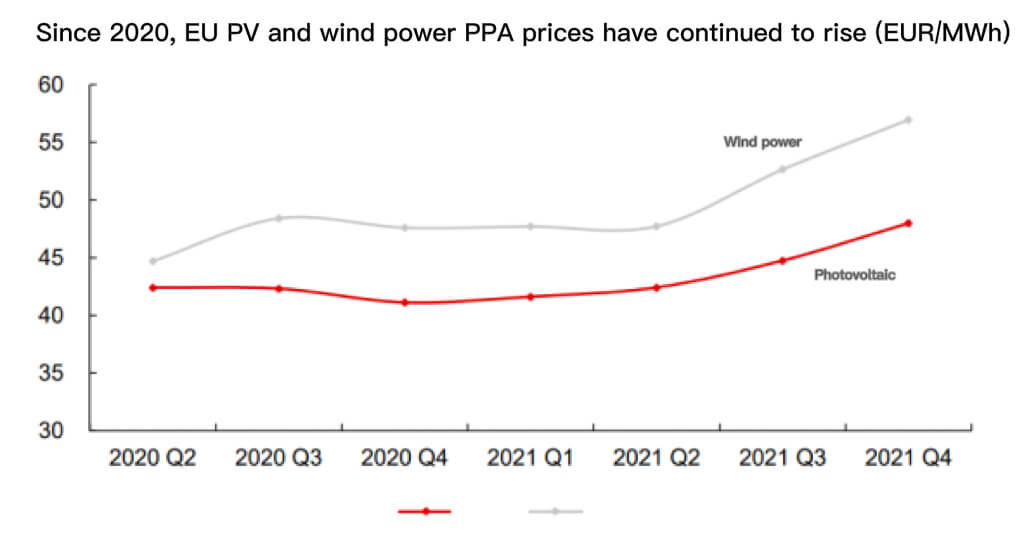 Since 2020, EU PV and wind power PPA prices have continued to rise (EUR/MWh)
Different market segments have their own characteristics
The European solar pv industry market has shown the characteristics of multi-point blooming in the past two years. The top ten installed capacity in the EU in 2021 will be Germany, Spain, the Netherlands, Poland, France, Greece, Denmark, Hungary, Italy, and Sweden, all of which have achieved year-on-year growth to varying degrees. Among non-EU countries, Turkey, Ukraine, the United Kingdom, and Switzerland also developed steadily.
The reasons for the growth of demand in each market segment are different. In terms of policies, net metering, renewable energy auctions, tax credits and other methods coexist, which have a significant impact on the growth of market segments. In addition, there are also differences in land resources, light resources and electricity prices, resulting in different installations in different countries.
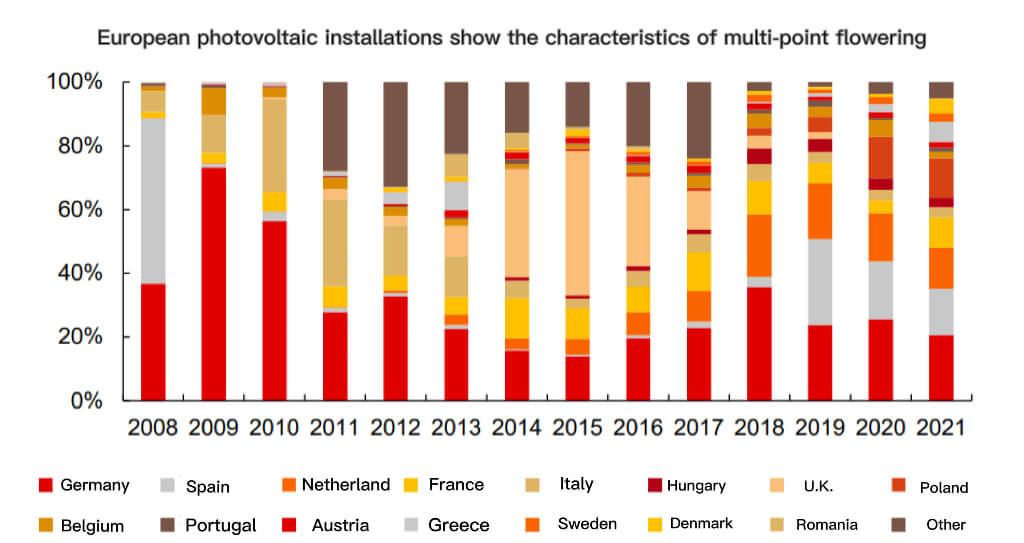
European photovoltaic installations show the characteristics of multi-point flowering
Look at them separately:
Germany
In the first cycle of solar pv industry development before 2012, Germany was the core of global PV demand for quite some time. In 2013-2018Q3, due to the withdrawal of subsidies and the European minimum price protection policy, the economics of photovoltaic projects were suppressed, and the installed capacity continued to be around 1.2-1.5GW.
Until 2018Q4, the European minimum price protection policy was lifted, which coincided with the “531” that pushed the price of the industrial chain to drop by nearly 30%, which pushed the German solar pv industry market into a secondary growth stage, and the installed capacity in 2020-2021 will increase to about 5GW.
In addition, in January 2021, Germany revised the feed-in tariff (EEG) law, and after the abolition of the distributed photovoltaic tax, the investment attractiveness of distributed photovoltaics has been further improved. In 2021, Germany will add 5.3GW of new photovoltaic capacity, an increase of 8% year-on-year. (Report source: Future Think Tank)
On February 28, 2022, the German climate authority proposed a new draft legislation to advance the goal of 100% renewable energy generation to 2035, 15 years ahead of the previous target. To accomplish this goal, the ministry also proposed a plan for renewable energy installations by 2035, which will be voted on by ministries.
Among them, the newly installed photovoltaic capacity will gradually increase from 7GW in 2022 to 20GW in 2028, and then maintain this level until 2035. Based on this calculation, the CAGR of Germany’s photovoltaic installations will reach 32% in 2021-2025.
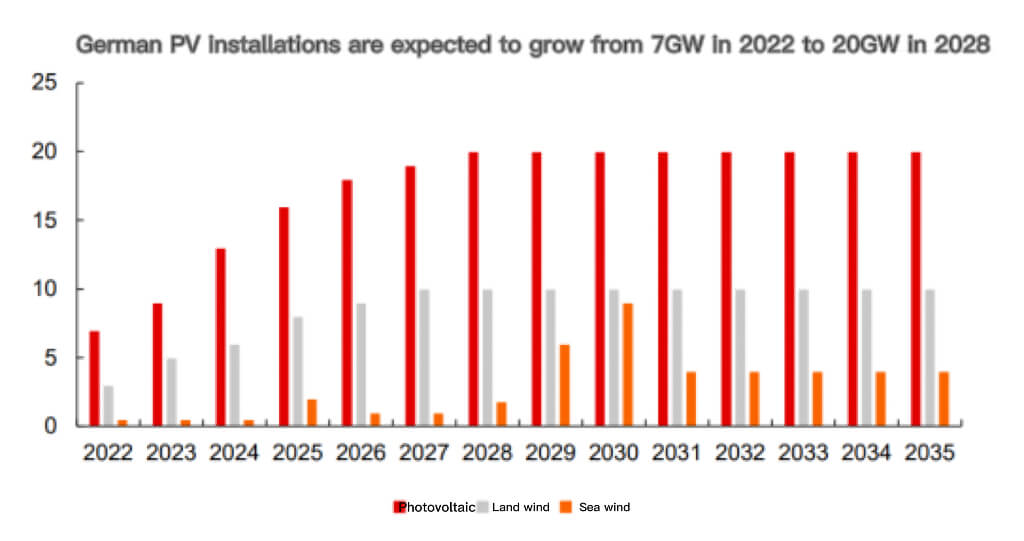 German PV installations are expected to grow from 7GW in 2022 to 20GW in 2028
Before the bill was released, the installed scale of photovoltaics in Germany had already entered the acceleration channel. We can see from the nearly doubling of the tender scale. The scale of German PV planning tenders in 2021 includes 1.85GW of ground power plants and 0.3GW of distributed power plants. In 2022, it will increase to 3.6GW and 2.3GW respectively, with a total year-on-year growth rate of 174%. The promulgation of the Act, Germany’s photovoltaic installation is expected to further accelerate.
Spain
Spain is a typical southern European solar pv industry market. In 2021, Spain’s photovoltaic installed capacity will be 3.8GW, maintaining the second place in Europe, a steady increase from 3.5GW in 2020.
In 2021, Spain’s policy support for photovoltaics will increase. In May 2021, the Spanish Parliament passed the “Climate Change Act”, which aims to achieve renewable energy consumption accounting for 42% of total energy consumption and renewable energy electricity accounting for 74% by 2030.
Also in 2021, Spain’s national climate and energy plan was approved, with a target of 39.2GW of cumulative photovoltaic installed capacity in 2030, a nearly triple increase from the current 13.6GW.
 Spain’s installed capacity in 2022-2025 is expected to remain around 4-5GW
The driving force of Spanish photovoltaics is more from economics. Benefiting from the favorable local light conditions, the yield of ground-based power plants is high, and the investment attractiveness is more advanced in the EU, so development is more prioritized.
Two renewable energy auctions in 2021 The CCP has issued a target of 2.9GW of ground-mounted photovoltaic power plants, most of which will be connected to the grid in 2023.
In terms of distributed photovoltaics, the development of solar pv industry has been slow before due to photovoltaic taxes. In 2021, it will gradually receive government support. In June 2021, the government will issue 450 million euros to invest in distributed photovoltaics.
Netherlands
The Netherlands will have 3.2GW of installed PV capacity in 2021, ranking third in Europe, up 11% year-on-year. Industrial and commercial roofs are the main support for photovoltaics in the Netherlands, accounting for more than 40%, mainly driven by the SDE++ bidding scheme.
In addition, under the support of the net metering policy, household photovoltaics also performed well, accounting for over 30%. The so-called net metering system refers to the owner’s self-use and surplus electricity grid mode, the grid electricity is calculated separately, and the corresponding proportion (usually 0.7-0.8) of electricity can be purchased free of charge from the grid when needed.
The driving force of the future Dutch solar pv industry market will still be the SDE++ tender plan for household net metering systems, industrial and commercial and ground-based power plants. In addition, as a representative of the Nordic countries, the Netherlands has a more profound and radical understanding of the energy transition. In 2021, the per capita photovoltaic installations will reach 765W, leading Europe.
 The installed capacity of the Netherlands will continue to grow in 2022-2025, and will exceed 4GW in 2023
France
France is the EU’s TOP5 solar pv industry market, with an installed capacity of 2.5GW in 2021, a year-on-year increase of more than 200%. France aims to have a cumulative installed capacity of 20GW by the end of 2023, and the previously relatively lengthy project procedures are being simplified in this context.
The driving force of French photovoltaics lies in the continuous increase in the scale of ground power plants and large-scale industrial and commercial bidding, which enables more projects to obtain on-grid tariffs. Household photovoltaics progress relatively slowly because the system is still imperfect.
By the end of 2021, France’s cumulative installed PV capacity has reached 12.3GW. According to the forecast of the French Renewable Energy Association (SER), the cumulative installed capacity in France is expected to reach 20.1GW in 2023, corresponding to an average installed capacity of 4GW in 2022-2023, a substantial increase from 2.5GW in 2021. In 2030, France’s cumulative installed and scale is expected to exceed 40GW.
 As of 2021Q2, power stations above 250kW account for 54% of the cumulative installed capacity in France
Poland
As an emerging solar pv industry market in the EU, Poland will add 2.5GW of installed capacity in 2020, becoming a GW-level country for the first time. In 2021, it will continue its high growth and achieve 3.1GW of new installed capacity, driving the cumulative installed capacity to 7.1GW. Distributed rooftop photovoltaics are the main form of installed capacity in the Netherlands, accounting for more than 70% of the cumulative installed capacity of 7.1GW.
Drivers for Polish PV include self-consumption schemes favourable to plant investors, net metering systems for households and lower VAT and income tax rates.
Turkey
Turkey is a European infrastructure powerhouse and the country with the largest installed PV capacity among non-EU countries. In 2021, Turkey’s photovoltaic installed capacity will be 1.14GW, nearly doubling year-on-year.
Before 2020, thanks to the promotion of the Renewable Energy Tendering (YEKA) model, a large number of ground-based power plants were developed, but YEKA ended without a hitch due to financing difficulties, exchange rate fluctuations and other factors. At present, the Turkish solar pv industry market is dominated by rooftop distributed photovoltaics. After the introduction of net metering in May 2020, rooftop photovoltaics have flourished.
On March 26, 2022, the Turkish Ministry of Trade announced that in response to the application of Turkish manufacturers, the first anti-dumping sunset review investigation was initiated on photovoltaic modules originating in China, and the impact on Chinese enterprises has yet to be tracked.
Ukraine
Ukraine has stopped importing natural gas to Russia since the Baston war with Russia in 2014, and the natural gas is now mainly imported from other European countries.
In this context, Ukraine’s energy security issues are particularly prominent, so new energy solar pv industry is also a key development direction. According to the National Energy Efficiency and Energy Conservation Association of Ukraine, in 2021H1 Ukraine’s photovoltaic installed capacity exceeds 0.4GW, including 0.26GW of ground power stations and 0.16GW of households.
Supply chain protection does not hinder exports to Europe
Supply chain protection does not hinder exports to Europe, looking for European opportunities for Chinese companies. The level of local manufacturing in Europe is limited, and it still relies on imports in the medium and long term
Europe supports local PV manufacturing, but still relies on imports. In March 2022, the European Union released “Raising Solar Ambition”. In order to achieve the photovoltaic installation target in the RePowerEU plan proposed by the European Commission and achieve energy independence as soon as possible, it further proposed to accelerate the construction of distributed and centralized photovoltaic power plants, promote the construction of photovoltaic power station projects, and improve local Manufacturing capacity and other short- and medium-term initiatives.
Among them, regarding local manufacturing, the EU plans to achieve a production scale of 20GW in 2025, and set up a 1 billion euro solar fund to invest in related manufacturing projects.
Even if it is pessimistically assumed that the EU’s installed capacity in 2025 will reach 50GW, the capacity ratio will be 1.25, and the corresponding module demand will be 62GW. According to the 90% operating rate of local module companies, there are still more than 40GW of modules that rely on imports, accounting for about 70%.
 In 2020, 75% of EU components will be imported from mainland China
The original intention of the EU to support local photovoltaic manufacturing is to ensure energy security and successfully achieve the goal of energy transition, rather than trade protection in the early years, which reduced the competitiveness of Chinese products by levying tariffs.
The bill also mentions the importance of solar pv industry market driving, and clearly proposes to develop local solar pv industry manufacturing while eliminating European trade barriers and creating a level playing field for photovoltaic products manufactured in Europe and other regions.
The demand for imported components in Europe will be mainly met by Chinese companies. Chinese photovoltaic companies have absolute advantages in crystalline silicon photovoltaic technology, manufacturing costs, industrial clusters, and institutional guidance.
Therefore, the European solar pv industry market is still one of the important markets for Chinese photovoltaic companies, and the growth of the European solar pv industry market will also drive the scale growth of related Chinese companies.
Components, inverters, brackets, breakthrough points made in China
Chinese PV companies mainly export products to Europe including modules, inverters, brackets, etc. In the context of accelerated growth in European solar pv industry market demand, relevant Chinese companies are expected to continue to benefit.
Chinese PV companies mainly export products to Europe including modules, inverters, brackets, etc. In the context of accelerated growth in European solar pv industry market demand, relevant Chinese companies are expected to continue to benefit.
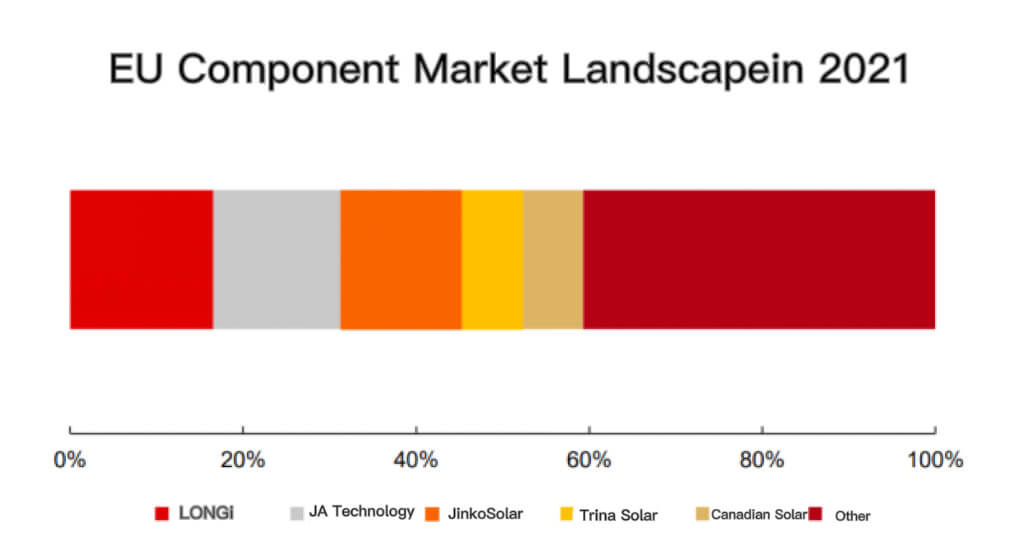 EU Component Market Landscape in 2021
In the module segment, it is conservatively estimated that China’s exports to Europe will exceed 40GW in 2021, a year-on-year increase of over 50%2. Among them, LONGi, JinkoSolar, JA Solar, Trina Solar and Canadian Solar all occupy relatively high solar pv industry market shares in Europe.
According to the proportion of the European solar pv industry market to the total shipments of various integrated module companies, JA Solar ≈ Jinko > Canadian Solar > LONGi > TRW.
In the inverter segment, due to the more distributed power stations in the European solar pv industry market, there is a greater demand for small string products and energy storage products. Among Chinese inverter companies, Huawei, Sungrow, GoodWe, Jinlang Technology, Growatt, and Deye shares have a presence in Europe. From the perspective of the proportion of its own shipments in listed companies, GoodWe has the highest, about 30%, followed by Sungrow and Jinlang Technology, about 10%. Here are the details about the inverter battery.
In the bracket segment, the main solar pv industry market is the southern European market where ground-based power stations are the majority. In May 2018, Trina Solar launched tracking stent business in other markets including southern Europe by acquiring Nclave, a local tracking stent company in Spain. In 2020, Nclave will occupy 12% market share in Europe, ranking third.
![]() 2020 European tracking bracket market landscape
2020 European tracking bracket market landscape